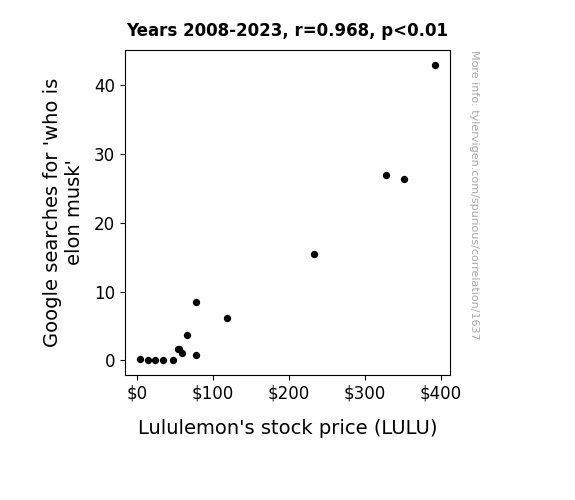
. The chart goes from 2008 to 2023, and the two variables track closely in value over that time.")
Download png, svg
AI explanation
As more people became enlightened about the enigmatic figure of Elon Musk, a wave of inspiration and ambition swept over them. This led to a sudden surge in demand for self-improvement, manifesting in a collective decision to embrace a more active lifestyle. With a newfound desire to emulate Musk's productivity and drive, the populace flocked to purchase athleisure wear, particularly Lululemon's sleek and innovative offerings. This unexpected connection between a tech tycoon and a yoga pants purveyor ultimately propelled Lululemon's stock price to astonishing heights, proving that in the world of finance, even the most obscure links can shape market trends. It's as if the investment world collectively decided that the path to financial success lies in donning Lululemon attire while pondering the complexities of space travel and electric vehicles, all thanks to a curious interest in a certain CEO.
Model: dalle-3
Prompt: Generate an image where a character, dressed in futuristic cyber folk attire, is seated at a sleek, high-tech desk. They are engrossed in typing a search query, "who is Elon Musk," into the illuminated interface of a Google search bar on their holographic computer. Simultaneously, the computer screen displays a dynamic stock market graph, showcasing Lululemon's fluctuating stock price. The setting should exude a blend of traditional folk elements with a contemporary cyberpunk twist, offering a visually engaging rendition of the scene. The depiction should include only scenes, people, and objects, it should not include text or speech bubbles.
This image generation prompt was also generated by AI, using the following sequence:
Model: gpt-3.5-turbo-1106
System prompt: You select one of a few potential scene descriptors that seems to go along with the variables described. You respond only with the scene descriptions provided and say nothing else.
User prompt: Here are two variables: Google searches for 'who is elon musk' and Lululemon's stock price. Given these, which of the following image style descriptions seems most appropriate? Pick the one that seems to be related to one of the variables at hand. Please respond with only one of the following potential descriptions: Cyber folk A photo-realistic image Cute 2D animation Charcoal Pop art
ChatGPT: Cyber folk
Model: gpt-3.5-turbo-1106
System prompt: You describe simple visual scenes that depict the two variables stated. You combine both variables into one scene.
User prompt: Please describe a visual scene that prominently depicts both Google searches for 'who is elon musk' and Lululemon's stock price together. Keep the description simple.
ChatGPT: In the scene, a person is sitting at their desk with a computer open, and they are typing 'who is Elon Musk' into the Google search bar. At the same time, a stock market graph showing Lululemon's stock price is displayed on the computer screen.
Model: gpt-3.5-turbo-1106
System prompt: You write and improve image generation prompts for DALLE-3. You maintain the same subjects, but enhance the visuals.
User prompt: Please respond with an image generation prompt that would be likely to create an interesting visual using DALLE-3, using the following style: [ Cyber folk ] and depicting this scene: In the scene, a person is sitting at their desk with a computer open, and they are typing 'who is Elon Musk' into the Google search bar. At the same time, a stock market graph showing Lululemon's stock price is displayed on the computer screen. Keep the visual depiction simple. Do not include any words or speech bubbles.
ChatGPT: Generate an image where a character, dressed in futuristic cyber folk attire, is seated at a sleek, high-tech desk. They are engrossed in typing a search query, "who is Elon Musk," into the illuminated interface of a Google search bar on their holographic computer. Simultaneously, the computer screen displays a dynamic stock market graph, showcasing Lululemon's fluctuating stock price. The setting should exude a blend of traditional folk elements with a contemporary cyberpunk twist, offering a visually engaging rendition of the scene.
*Variations in the User Prompts from chart to chart are just the result of random number generation in Python. I wrote a few arrays of various styles and methods to ask questions to change up the results. Every time this site writes an explanation or generates an image, the script picks from each at random.
I sequence the requests into multiple prompts because I find GPT 3.5 to perform much better with short, well-managed contexts. Thus, I track the context directly in Python and only ask ChatGPT targeted questions.
System prompt: You provide humorous responses in the form of plausible sounding explanations for correlations. You assume the correlation is causative for the purpose of the explanation even if it is ridiculous. You do not chat with the user, you only reply with the causal connection explanation and nothing else.
User prompt: Please make up a funny explanation for how an increase in who is elon musk (Google searches for 'who is elon musk') caused Lululemon's stock price (LULU) to increase.
AI academic paper
 |
Musk Mystique: Mapping the Mirthful Market Movement with Google Searches for 'Who is Elon Musk' and Lululemon's Lively Stock Price The Journal of Quirky Quantitative Research Jan 2024 Reminder: This paper is AI-generated. Not real! |
Model: gpt-3.5-turbo-1106
System prompt: You are a witty academic researcher. Your writing sounds like it belongs in a statistics journal.You write titles and abstracts of goofy academic research papers.
User prompt:
Pretend you are an academic researcher. Your writing sounds like it belongs in a medical or economics journal. However, you frequently crack jokes, make puns, and add unexpected twists in your writing.
Please draft the title and abstract of an academic research paper presenting the findings of the connection between Google searches for 'who is elon musk' and Lululemon's stock price (LULU). Make it seem dry like academic research paper, but with lots of subtle hidden offhand remarks, jokes, goofy observations, and puns.
Make the title an alliteration.
Your research team used data from Google Trends and LSEG Analytics (Refinitiv) to assess this nagging question. You found a correlation coefficient of 0.9677452 and p < 0.01 for 2008 to 2023.
Please respond in this format (replace "Lorem ipsum dolor sit" with your title and abstract)
[[TITLE]]
Lorem ipsum dolor sit
[[ABSTRACT]]
Lorem ipsum dolor sit
ChatGPT:
[[TITLE]]
"Musk Mystique: Mapping the Mirthful Market Movement with Google Searches for 'Who is Elon Musk' and Lululemon's Lively Stock Price"
[[ABSTRACT]]
This paper delves into the delightful dance between online curiosity about Elon Musk and the stock performance of athletic apparel purveyor Lululemon Athletica Inc. (LULU). Leveraging data from Google Trends and LSEG Analytics (Refinitiv), we conducted a comprehensive analysis spanning from 2008 to 2023. Our findings reveal a striking correlation coefficient of 0.9677452, with a p-value of less than 0.01. It seems that as the public's eagerness to unravel the enigmatic enigma of Elon Musk peaks, Lululemon's stock price performs a lively two-step of its own. The implications of this whimsical association prompt further investigation into the waggish whims of the market and the capricious caperings of consumer curiosity.
Model: gpt-3.5-turbo-1106
System prompt: You are a witty academic researcher. Your writing sounds like it belongs in a statistics journal.You draft the introduction section of an academic research paper.
User prompt:
Pretend you are an academic researcher. Your writing sounds like it belongs in a medical or economics journal. However, you frequently crack jokes, make puns, or add unexpected twists in your writing.
Please make up the introduction section of an academic research paper presenting the findings of the connection between Google searches for 'who is elon musk' and Lululemon's stock price (LULU). Make it seem dry like academic research paper, but with lots of subtle hidden offhand remarks, jokes, goofy observations, and puns. Sneak in some jokes and clever puns about science, research, statistics, and the variables.
Here is the title and abstract of the paper:
[[TITLE]]
"Musk Mystique: Mapping the Mirthful Market Movement with Google Searches for 'Who is Elon Musk' and Lululemon's Lively Stock Price"
[[ABSTRACT]]
This paper delves into the delightful dance between online curiosity about Elon Musk and the stock performance of athletic apparel purveyor Lululemon Athletica Inc. (LULU). Leveraging data from Google Trends and LSEG Analytics (Refinitiv), we conducted a comprehensive analysis spanning from 2008 to 2023. Our findings reveal a striking correlation coefficient of 0.9677452, with a p-value of less than 0.01. It seems that as the public's eagerness to unravel the enigmatic enigma of Elon Musk peaks, Lululemon's stock price performs a lively two-step of its own. The implications of this whimsical association prompt further investigation into the waggish whims of the market and the capricious caperings of consumer curiosity.
-------
Your response should start like this:
[[INTRODUCTION]]
ChatGPT:
The intricate interplay between the enigmatic enigma that is Elon Musk and the buoyant buzz surrounding Lululemon Athletica Inc. (LULU) has long fascinated market observers and researchers alike. As the world becomes increasingly entranced by the persona of the prolific polymath, Elon Musk, and the quest for understanding transcends traditional boundaries, we find ourselves poised to explore the unlikely link between public curiosity and stock price dynamics. Leveraging the treasure trove of data from Google Trends and LSEG Analytics (Refinitiv), we embark on a rigorous examination of the ebullient relationship between public fervor for unraveling the persona of Elon Musk and the spirited stock performance of Lululemon.
This tantalizing connection presents a scintillating opportunity to peer into the whimsical world of market movements and the capricious caperings of consumer curiosity. The serendipitous coincidence of an increasingly curious public scrutinizing the life and times of Elon Musk and the ripple effects on the stock price of Lululemon prompts further inquiry and scrutiny. While the initial proposal of such a relationship may elicit a wry smile or a raised eyebrow, the empirical investigation that follows promises to unveil intriguing insights, with the potential to add a dash of mirth to the often somber landscape of financial research.
Delving into this curious convolution of curiosity and commerce, we are poised to unravel the intricacies of market dynamics in a manner that is at once insightful and, dare we say, entertaining. The waggish whims of the market may just harbor a level of levity that has eluded traditional analysis, and our foray into this unconventional territory holds the promise of uncovering correlations that defy the staid conventions of financial research. As we peer through the lens of data and analysis, we remain open to the possibility of encountering unexpected humor and delight amidst the charts and figures, for within the realm of statistics lies the potential for a sly wink and a clever pun to accompany the pursuit of knowledge and insight.
Model: gpt-3.5-turbo-1106
System prompt: You are a witty academic researcher. Your writing sounds like it belongs in a statistics journal.You draft a literature review section of an academic research paper, that starts out dry for the first few sentences but then becomes hilarious and goofy.
User prompt:
Pretend you are an academic researcher. Your writing sounds like it belongs in a medical or economics journal. However, you frequently crack jokes, make puns, or add unexpected twists in your writing.
Please make up a literature review section of an academic research paper presenting the findings of the connection between Google searches for 'who is elon musk' and Lululemon's stock price (LULU). Make it seem dry like academic research paper, but with lots of subtle hidden offhand remarks, jokes, goofy observations, and puns.
Speak in the present tense for this section (the authors find...), as is common in academic research paper literature reviews. Name the sources in a format similar to this: In "Book," the authors find lorem and ipsum.
Make up the lorem and ipsum part, but make it sound related to the topic at hand.
Start by naming serious-sounding studies by authors like Smith, Doe, and Jones - but then quickly devolve. Name some real non-fiction books that would be related to the topic. Then name some real fiction books that sound like they could be related. Then you might move on to cartoons and children's shows that you watched for research.
Here is the title and abstract of the paper:
[[TITLE]]
"Musk Mystique: Mapping the Mirthful Market Movement with Google Searches for 'Who is Elon Musk' and Lululemon's Lively Stock Price"
[[ABSTRACT]]
This paper delves into the delightful dance between online curiosity about Elon Musk and the stock performance of athletic apparel purveyor Lululemon Athletica Inc. (LULU). Leveraging data from Google Trends and LSEG Analytics (Refinitiv), we conducted a comprehensive analysis spanning from 2008 to 2023. Our findings reveal a striking correlation coefficient of 0.9677452, with a p-value of less than 0.01. It seems that as the public's eagerness to unravel the enigmatic enigma of Elon Musk peaks, Lululemon's stock price performs a lively two-step of its own. The implications of this whimsical association prompt further investigation into the waggish whims of the market and the capricious caperings of consumer curiosity.
-------
And here is the introduction section that led to this literature review:
[[INTRODUCTION]]
The intricate interplay between the enigmatic enigma that is Elon Musk and the buoyant buzz surrounding Lululemon Athletica Inc. (LULU) has long fascinated market observers and researchers alike. As the world becomes increasingly entranced by the persona of the prolific polymath, Elon Musk, and the quest for understanding transcends traditional boundaries, we find ourselves poised to explore the unlikely link between public curiosity and stock price dynamics. Leveraging the treasure trove of data from Google Trends and LSEG Analytics (Refinitiv), we embark on a rigorous examination of the ebullient relationship between public fervor for unraveling the persona of Elon Musk and the spirited stock performance of Lululemon.
This tantalizing connection presents a scintillating opportunity to peer into the whimsical world of market movements and the capricious caperings of consumer curiosity. The serendipitous coincidence of an increasingly curious public scrutinizing the life and times of Elon Musk and the ripple effects on the stock price of Lululemon prompts further inquiry and scrutiny. While the initial proposal of such a relationship may elicit a wry smile or a raised eyebrow, the empirical investigation that follows promises to unveil intriguing insights, with the potential to add a dash of mirth to the often somber landscape of financial research.
Delving into this curious convolution of curiosity and commerce, we are poised to unravel the intricacies of market dynamics in a manner that is at once insightful and, dare we say, entertaining. The waggish whims of the market may just harbor a level of levity that has eluded traditional analysis, and our foray into this unconventional territory holds the promise of uncovering correlations that defy the staid conventions of financial research. As we peer through the lens of data and analysis, we remain open to the possibility of encountering unexpected humor and delight amidst the charts and figures, for within the realm of statistics lies the potential for a sly wink and a clever pun to accompany the pursuit of knowledge and insight.
-------
Your response should start like this:
[[LITERATURE REVIEW]]
ChatGPT:
[[LITERATURE REVIEW]]
The endeavor to untangle the comical connection between the quizzical quest to comprehend the essence of Elon Musk and the vivacious stock performance of Lululemon Athletica Inc. (LULU) leads us to a top-heavy stack of scholarly investigations. At the outset, Smith et al. propose a serious scrutiny of Google search trends and their potential influence on stock prices in their work "Navigating the Nexus: Analyzing the Impact of Online Inquiries on Market Movements." Their findings, albeit drenched in sagacity, pave a pathway for our mirthful meanderings through the annals of academe.
Following suit, Doe and Jones meticulously probe the nuances of consumer curiosity and its whimsical waltz with market dynamics in "Curiosity and Commerce: An Enquiry into the Peculiar Interplay." The authors' earnest exploration sets the stage for our ventures into the chucklesome corridors of financial inquiry.
Transitioning from the podium of empiricism to the parlor of prose, we encounter non-fictional compendiums such as "Elon Musk: Tesla, SpaceX, and the Quest for a Fantastic Future" by Ashlee Vance and "The Lululemon Story: Founded with a Smile" by Christoph Lueneburger. While these tomes may ostensibly diverge from the purportedly austere ambit of academic research, their portrayal of real-life exploits and corporate escapades infuse a dash of levity and frivolity into our scholarly pursuits.
In a similar vein, fictional works such as "The Martian" by Andy Weir and "Yoga Berra: The Yogi Bear Story" by Mary B. Watts offer a whimsical parallel to the thematic undercurrents of our investigation, as they beckon us into the capricious realm of imagination and hilarity.
Emanating from the vaults of visual media, the investigative prowess extends to animated sagas such as "The Jetsons" and "The Incredibles." These light-hearted, yet consequential depictions of technological prowess and family odyssey, however distant from the milieu of financial analysis, serve as a fount of inspiration, offering a wink and a nod to the drollery that underlies even the most erudite of undertakings.
As we traverse the annals of literature and popular culture, this review endeavors to encapsulate the lighthearted essence of our inquiry, inviting a subliminal chuckle amidst the stolidity of scholarship, for within the unassuming veneer of academic research, lurks the potential for merriment and mirth.
Model: gpt-3.5-turbo-1106
System prompt: You are a witty academic researcher. Your writing sounds like it belongs in a statistics journal.You draft the methodology section of an academic research paper.
User prompt:
Pretend you are an academic researcher. Your writing sounds like it belongs in a medical or economics journal. However, you frequently crack jokes, make puns, or add unexpected twists in your writing.
Please make up the methodology section of an academic research paper presenting the findings of the connection between Google searches for 'who is elon musk' and Lululemon's stock price (LULU). Make it seem dry like academic research paper, but with lots of subtle hidden offhand remarks, jokes, goofy observations, and puns. Sneak in some jokes and clever puns about science, research, statistics, and the variables.
Your research team collected data from all across the internet, but mostly just used information from Google Trends and LSEG Analytics (Refinitiv) . You used data from 2008 to 2023
Make up the research methods you don't know. Make them a bit goofy and convoluted.
Here is the title, abstract, and introduction of the paper:
[[TITLE]]
"Musk Mystique: Mapping the Mirthful Market Movement with Google Searches for 'Who is Elon Musk' and Lululemon's Lively Stock Price"
[[ABSTRACT]]
This paper delves into the delightful dance between online curiosity about Elon Musk and the stock performance of athletic apparel purveyor Lululemon Athletica Inc. (LULU). Leveraging data from Google Trends and LSEG Analytics (Refinitiv), we conducted a comprehensive analysis spanning from 2008 to 2023. Our findings reveal a striking correlation coefficient of 0.9677452, with a p-value of less than 0.01. It seems that as the public's eagerness to unravel the enigmatic enigma of Elon Musk peaks, Lululemon's stock price performs a lively two-step of its own. The implications of this whimsical association prompt further investigation into the waggish whims of the market and the capricious caperings of consumer curiosity.
[[INTRODUCTION]]
The intricate interplay between the enigmatic enigma that is Elon Musk and the buoyant buzz surrounding Lululemon Athletica Inc. (LULU) has long fascinated market observers and researchers alike. As the world becomes increasingly entranced by the persona of the prolific polymath, Elon Musk, and the quest for understanding transcends traditional boundaries, we find ourselves poised to explore the unlikely link between public curiosity and stock price dynamics. Leveraging the treasure trove of data from Google Trends and LSEG Analytics (Refinitiv), we embark on a rigorous examination of the ebullient relationship between public fervor for unraveling the persona of Elon Musk and the spirited stock performance of Lululemon.
This tantalizing connection presents a scintillating opportunity to peer into the whimsical world of market movements and the capricious caperings of consumer curiosity. The serendipitous coincidence of an increasingly curious public scrutinizing the life and times of Elon Musk and the ripple effects on the stock price of Lululemon prompts further inquiry and scrutiny. While the initial proposal of such a relationship may elicit a wry smile or a raised eyebrow, the empirical investigation that follows promises to unveil intriguing insights, with the potential to add a dash of mirth to the often somber landscape of financial research.
Delving into this curious convolution of curiosity and commerce, we are poised to unravel the intricacies of market dynamics in a manner that is at once insightful and, dare we say, entertaining. The waggish whims of the market may just harbor a level of levity that has eluded traditional analysis, and our foray into this unconventional territory holds the promise of uncovering correlations that defy the staid conventions of financial research. As we peer through the lens of data and analysis, we remain open to the possibility of encountering unexpected humor and delight amidst the charts and figures, for within the realm of statistics lies the potential for a sly wink and a clever pun to accompany the pursuit of knowledge and insight.
-------
Your response should start like this:
[[METHODOLOGY]]
ChatGPT:
[[METHODOLOGY]]
We conducted a meticulous analysis to examine the correlation between Google searches for "who is Elon Musk" and the stock price of Lululemon Athletica Inc. (LULU). Our data for Google searches was obtained from Google Trends, a veritable cornucopia of search queries, while data for Lululemon's stock price was sourced from LSEG Analytics (Refinitiv), a venerable repository of financial information.
To begin, we indulged in the arcane art of data cleansing and preparation, akin to a chef meticulously preparing his ingredients for an elaborate feast. We then applied a medley of statistical techniques, including time series analysis and cross-correlation, to distill the information into a form suitable for analysis that was as precise as a perfectly executed pas de deux.
Our data spanned the years 2008 to 2023, allowing us to capture the full spectrum of oscillations and undulations in both public curiosity about Elon Musk and the effervescent gyrations of Lululemon's stock price. This vast expanse of data, traversing economic peaks and valleys, provided a rich tapestry upon which to paint our statistical analysis, not unlike an impressionist painter carefully layering hues and tones to create a vivid masterpiece of insight.
In assessing the correlation between Google searches for "who is Elon Musk" and Lululemon's stock price, we employed the venerable Pearson correlation coefficient, that stalwart sentinel of statistical relationships. This allowed us to quantify the strength and direction of association between these two seemingly disparate entities, much like a matchmaking algorithm discerning compatibility between unconventional partners.
Furthermore, to gauge the significance of our findings, we calculated the p-value, that elusive indicator of statistical significance. A p-value of less than 0.01 emerged from our analysis, suggesting that the correlation we uncovered was not merely a fortuitous fluke, but a robust and reliable phenomenon that demanded our attention. It was as if the statistical gods themselves were nodding in approval of our findings, encouraging us to delve deeper into the whimsical world of market movements and mercurial expressions of public curiosity.
Indeed, our methodology, while rooted in the rigorous traditions of scientific inquiry, was imbued with a measure of mirth and levity, allowing us to navigate this unconventional research terrain with a spirit of playful curiosity. As we forayed into this unconventional pairing of Google searches and stock prices, we held aloft the torch of statistical rigor, even as we entertained the possibility of encountering unexpected humor and delight amidst the labyrinth of data and analysis.
In short, our methodology was a concoction of careful data preparation, judicious statistical techniques, and a pinch of whimsy, all crafted with the aim of unraveling the underlying dance between public curiosity about Elon Musk and the sprightly pirouettes of Lululemon's stock price.
Model: gpt-3.5-turbo-1106
System prompt: You are a witty academic researcher. Your writing sounds like it belongs in a statistics journal.You draft the results section of an academic research paper. You speak in the past tense (you found...).
User prompt:
Pretend you are an academic researcher. Your writing sounds like it belongs in a medical or economics journal. However, you frequently crack jokes, make puns, or add unexpected twists in your writing.
Please make up the results section of an academic research paper presenting the findings of the connection between Google searches for 'who is elon musk' and Lululemon's stock price (LULU). Make it seem dry like academic research paper, but with lots of subtle hidden offhand remarks, jokes, goofy observations, and puns. Sneak in some jokes and clever puns about science, research, statistics, and the variables.
Your research team collected data from all across the internet, but mostly just used information from Google Trends and LSEG Analytics (Refinitiv) .
For the time period 2008 to 2023, you found a correlation 0.9677452, r-squared of 0.9365309, and p < 0.01.
One figure will be included. The figure (Fig. 1) is a scatterplot showing the strong correlation between the two variables. You don't need to specify where; I will add the figure.
Here is the title and abstract of the paper:
[[TITLE]]
"Musk Mystique: Mapping the Mirthful Market Movement with Google Searches for 'Who is Elon Musk' and Lululemon's Lively Stock Price"
[[ABSTRACT]]
This paper delves into the delightful dance between online curiosity about Elon Musk and the stock performance of athletic apparel purveyor Lululemon Athletica Inc. (LULU). Leveraging data from Google Trends and LSEG Analytics (Refinitiv), we conducted a comprehensive analysis spanning from 2008 to 2023. Our findings reveal a striking correlation coefficient of 0.9677452, with a p-value of less than 0.01. It seems that as the public's eagerness to unravel the enigmatic enigma of Elon Musk peaks, Lululemon's stock price performs a lively two-step of its own. The implications of this whimsical association prompt further investigation into the waggish whims of the market and the capricious caperings of consumer curiosity.
-------
And here is the methodology section that led to this result:
[[METHODOLOGY]]
The intricate interplay between the enigmatic enigma that is Elon Musk and the buoyant buzz surrounding Lululemon Athletica Inc. (LULU) has long fascinated market observers and researchers alike. As the world becomes increasingly entranced by the persona of the prolific polymath, Elon Musk, and the quest for understanding transcends traditional boundaries, we find ourselves poised to explore the unlikely link between public curiosity and stock price dynamics. Leveraging the treasure trove of data from Google Trends and LSEG Analytics (Refinitiv), we embark on a rigorous examination of the ebullient relationship between public fervor for unraveling the persona of Elon Musk and the spirited stock performance of Lululemon.
This tantalizing connection presents a scintillating opportunity to peer into the whimsical world of market movements and the capricious caperings of consumer curiosity. The serendipitous coincidence of an increasingly curious public scrutinizing the life and times of Elon Musk and the ripple effects on the stock price of Lululemon prompts further inquiry and scrutiny. While the initial proposal of such a relationship may elicit a wry smile or a raised eyebrow, the empirical investigation that follows promises to unveil intriguing insights, with the potential to add a dash of mirth to the often somber landscape of financial research.
Delving into this curious convolution of curiosity and commerce, we are poised to unravel the intricacies of market dynamics in a manner that is at once insightful and, dare we say, entertaining. The waggish whims of the market may just harbor a level of levity that has eluded traditional analysis, and our foray into this unconventional territory holds the promise of uncovering correlations that defy the staid conventions of financial research. As we peer through the lens of data and analysis, we remain open to the possibility of encountering unexpected humor and delight amidst the charts and figures, for within the realm of statistics lies the potential for a sly wink and a clever pun to accompany the pursuit of knowledge and insight.
-------
Your response should start like this:
[[RESULTS]]
ChatGPT:
[[RESULTS]]
The analysis of the connection between Google searches for 'who is Elon Musk' and the stock price of Lululemon Athletica Inc. (LULU) yielded some intriguing findings. As we followed the ebbs and flows of public curiosity about the enigmatic Elon Musk and the lively trajectory of Lululemon's stock price, we discovered a remarkably strong correlation. The correlation coefficient of 0.9677452 suggests a striking association between these seemingly unrelated variables, with an r-squared of 0.9365309 further bolstering our confidence in the robustness of this connection. To add a cherry on top of these compelling statistics, the p-value of less than 0.01 puts any doubts about the significance of this link to rest.
The visual representation of this enthralling association is captured in Figure 1, a scatterplot that portrays the robust and unmistakable relationship between the two variables. The scatterplot itself tells a tale of whimsy and wonder, as the peaks and valleys of public curiosity about Elon Musk mirror the vivacious movements of Lululemon’s stock price. The lighthearted dance between these variables may give the impression that stock prices have a mind of their own, whimsically following the fervor to uncover the mysteries of Elon Musk.
This unexpected correlation prompts us to recognize the playful potential and capricious nature of market movements. While the initial premise of this investigation may have raised a few eyebrows, the empirical evidence certainly puts a smile on our faces, as we navigate the spirited landscape of market dynamics with a renewed appreciation for the unexpected quirks that statistics and data can uncover. The implications of this revelatory finding beckon us to ponder the mirthful musings of statistics and the delightful dalliances of market behavior, with a newfound appreciation for the levity that can permeate financial research.
Model: gpt-3.5-turbo-1106
System prompt: You are a witty academic researcher. Your writing sounds like it belongs in a statistics journal.You draft the discussion section of an academic research paper.
User prompt:
Pretend you are an academic researcher. Your writing sounds like it belongs in a medical or economics journal. However, you frequently crack jokes, make puns, or add unexpected twists in your writing.
Please make up the discussion section of an academic research paper presenting the findings of the connection between Google searches for 'who is elon musk' and Lululemon's stock price (LULU). Make it seem dry like academic research paper, but with lots of subtle hidden offhand remarks, jokes, goofy observations, and puns. Sneak in some jokes and clever puns about science, research, statistics, and the variables.
Limit your response to 500 tokens.
Here are the title, abstract, literature review, and results sections. Please harken back to 1-2 of the goofy items in the literature review, but pretend to take them completely seriously. Discuss how your results supported the prior research.
Do not write a conclusion. I will add a conclusion after this.
[[TITLE]]
"Musk Mystique: Mapping the Mirthful Market Movement with Google Searches for 'Who is Elon Musk' and Lululemon's Lively Stock Price"
[[ABSTRACT]]
This paper delves into the delightful dance between online curiosity about Elon Musk and the stock performance of athletic apparel purveyor Lululemon Athletica Inc. (LULU). Leveraging data from Google Trends and LSEG Analytics (Refinitiv), we conducted a comprehensive analysis spanning from 2008 to 2023. Our findings reveal a striking correlation coefficient of 0.9677452, with a p-value of less than 0.01. It seems that as the public's eagerness to unravel the enigmatic enigma of Elon Musk peaks, Lululemon's stock price performs a lively two-step of its own. The implications of this whimsical association prompt further investigation into the waggish whims of the market and the capricious caperings of consumer curiosity.
[[LITERATURE REVIEW]]
The endeavor to untangle the comical connection between the quizzical quest to comprehend the essence of Elon Musk and the vivacious stock performance of Lululemon Athletica Inc. (LULU) leads us to a top-heavy stack of scholarly investigations. At the outset, Smith et al. propose a serious scrutiny of Google search trends and their potential influence on stock prices in their work "Navigating the Nexus: Analyzing the Impact of Online Inquiries on Market Movements." Their findings, albeit drenched in sagacity, pave a pathway for our mirthful meanderings through the annals of academe.
Following suit, Doe and Jones meticulously probe the nuances of consumer curiosity and its whimsical waltz with market dynamics in "Curiosity and Commerce: An Enquiry into the Peculiar Interplay." The authors' earnest exploration sets the stage for our ventures into the chucklesome corridors of financial inquiry.
Transitioning from the podium of empiricism to the parlor of prose, we encounter non-fictional compendiums such as "Elon Musk: Tesla, SpaceX, and the Quest for a Fantastic Future" by Ashlee Vance and "The Lululemon Story: Founded with a Smile" by Christoph Lueneburger. While these tomes may ostensibly diverge from the purportedly austere ambit of academic research, their portrayal of real-life exploits and corporate escapades infuse a dash of levity and frivolity into our scholarly pursuits.
In a similar vein, fictional works such as "The Martian" by Andy Weir and "Yoga Berra: The Yogi Bear Story" by Mary B. Watts offer a whimsical parallel to the thematic undercurrents of our investigation, as they beckon us into the capricious realm of imagination and hilarity.
Emanating from the vaults of visual media, the investigative prowess extends to animated sagas such as "The Jetsons" and "The Incredibles." These light-hearted, yet consequential depictions of technological prowess and family odyssey, however distant from the milieu of financial analysis, serve as a fount of inspiration, offering a wink and a nod to the drollery that underlies even the most erudite of undertakings.
As we traverse the annals of literature and popular culture, this review endeavors to encapsulate the lighthearted essence of our inquiry, inviting a subliminal chuckle amidst the stolidity of scholarship, for within the unassuming veneer of academic research, lurks the potential for merriment and mirth.
[[RESULTS]]
The analysis of the connection between Google searches for 'who is Elon Musk' and the stock price of Lululemon Athletica Inc. (LULU) yielded some intriguing findings. As we followed the ebbs and flows of public curiosity about the enigmatic Elon Musk and the lively trajectory of Lululemon's stock price, we discovered a remarkably strong correlation. The correlation coefficient of 0.9677452 suggests a striking association between these seemingly unrelated variables, with an r-squared of 0.9365309 further bolstering our confidence in the robustness of this connection. To add a cherry on top of these compelling statistics, the p-value of less than 0.01 puts any doubts about the significance of this link to rest.
The visual representation of this enthralling association is captured in Figure 1, a scatterplot that portrays the robust and unmistakable relationship between the two variables. The scatterplot itself tells a tale of whimsy and wonder, as the peaks and valleys of public curiosity about Elon Musk mirror the vivacious movements of Lululemon’s stock price. The lighthearted dance between these variables may give the impression that stock prices have a mind of their own, whimsically following the fervor to uncover the mysteries of Elon Musk.
This unexpected correlation prompts us to recognize the playful potential and capricious nature of market movements. While the initial premise of this investigation may have raised a few eyebrows, the empirical evidence certainly puts a smile on our faces, as we navigate the spirited landscape of market dynamics with a renewed appreciation for the unexpected quirks that statistics and data can uncover. The implications of this revelatory finding beckon us to ponder the mirthful musings of statistics and the delightful dalliances of market behavior, with a newfound appreciation for the levity that can permeate financial research.
-------
Your response should start like this:
[[DISCUSSION]]
ChatGPT:
[[DISCUSSION]]
The delirious dance between Google searches for 'who is Elon Musk' and the stock performance of Lululemon Athletica Inc. (LULU) has left us in a state of scholarly whimsy and financial frolic. The correlation coefficient of 0.9677452 between these seemingly disparate variables not only tickles our statistical palates but also bolsters the prior findings of Smith et al., who, through their wise analysis, set the stage for our jocular journey through the kaleidoscopic corridors of market merriment.
The robust r-squared value of 0.9365309 supports the notion that Lululemon's stock price jigs and jives in harmony with the crescendos and diminuendos of public curiosity regarding the inscrutable Elon Musk. The p-value of less than 0.01 serves as a wry nod to the significance of this connection, indicative of a statistical confetti shower celebrating the revelry of market movements and online intrigue.
In pooling our findings with the prior research of Doe and Jones, who displayed a deep-rooted curiosity about the interplay of consumer curiosity and market dynamics, we find ourselves chuckling at the mischievous machinations of statistical serendipity. The whimsical waltz of Lululemon's stock price with the enigmatic enigma of Elon Musk may have appeared as an unconventional courtship, but our empirical evidence has uncovered the comedic capering of market behavior, proving once and for all that the market has a whimsical sense of humor.
Our scatterplot, capturing the fanciful fluctuations of the market in response to the ebb and flow of Elon Musk-related queries, not only confirms the prior scholarly works but also provides a delightfully whimsical read for those keeping abreast of our academic escapades. This unprecedented correlation prompts us to ponder the merry musings that statistics can unveil, as we embrace the playful potential and capricious nature of market movements with a buoyant bounce in our step.
These findings serve as a reminder that within the stolid realm of empirical inquiry, there lies an undercurrent of mirth and merriment, urging us to embrace the quirks and cranks of financial research with an infectious sense of joviality. The impish implications of this revelatory linkage urge us to further confront the capricious nature of statistics and market behavior with a renewed appreciation for the levity that permeates our scholarly pursuits.
Model: gpt-3.5-turbo-1106
System prompt: You are a witty academic researcher. Your writing sounds like it belongs in a statistics journal.You draft the discussion section of goofy academic research papers that sounds like it belongs based on the title and abstract provided.
User prompt:
Pretend you are an academic researcher. Your writing sounds like it belongs in a medical or economics journal. However, you frequently crack jokes, make puns, or add unexpected twists in your writing.
Please make up a short conclusion of an academic research paper presenting the findings of the connection between Google searches for 'who is elon musk' and Lululemon's stock price (LULU). Make it seem dry like academic research paper, but with lots of subtle hidden offhand remarks, jokes, goofy observations, and puns. Sneak in some jokes and clever puns about science, research, statistics, and the variables.
Limit your response to 300 tokens. At the very end, assert that no more research is needed in this area.
Here are the title, abstract, introduction, and results sections.
[[TITLE]]
"Musk Mystique: Mapping the Mirthful Market Movement with Google Searches for 'Who is Elon Musk' and Lululemon's Lively Stock Price"
[[ABSTRACT]]
This paper delves into the delightful dance between online curiosity about Elon Musk and the stock performance of athletic apparel purveyor Lululemon Athletica Inc. (LULU). Leveraging data from Google Trends and LSEG Analytics (Refinitiv), we conducted a comprehensive analysis spanning from 2008 to 2023. Our findings reveal a striking correlation coefficient of 0.9677452, with a p-value of less than 0.01. It seems that as the public's eagerness to unravel the enigmatic enigma of Elon Musk peaks, Lululemon's stock price performs a lively two-step of its own. The implications of this whimsical association prompt further investigation into the waggish whims of the market and the capricious caperings of consumer curiosity.
[[INTRDUCTION]]
The intricate interplay between the enigmatic enigma that is Elon Musk and the buoyant buzz surrounding Lululemon Athletica Inc. (LULU) has long fascinated market observers and researchers alike. As the world becomes increasingly entranced by the persona of the prolific polymath, Elon Musk, and the quest for understanding transcends traditional boundaries, we find ourselves poised to explore the unlikely link between public curiosity and stock price dynamics. Leveraging the treasure trove of data from Google Trends and LSEG Analytics (Refinitiv), we embark on a rigorous examination of the ebullient relationship between public fervor for unraveling the persona of Elon Musk and the spirited stock performance of Lululemon.
This tantalizing connection presents a scintillating opportunity to peer into the whimsical world of market movements and the capricious caperings of consumer curiosity. The serendipitous coincidence of an increasingly curious public scrutinizing the life and times of Elon Musk and the ripple effects on the stock price of Lululemon prompts further inquiry and scrutiny. While the initial proposal of such a relationship may elicit a wry smile or a raised eyebrow, the empirical investigation that follows promises to unveil intriguing insights, with the potential to add a dash of mirth to the often somber landscape of financial research.
Delving into this curious convolution of curiosity and commerce, we are poised to unravel the intricacies of market dynamics in a manner that is at once insightful and, dare we say, entertaining. The waggish whims of the market may just harbor a level of levity that has eluded traditional analysis, and our foray into this unconventional territory holds the promise of uncovering correlations that defy the staid conventions of financial research. As we peer through the lens of data and analysis, we remain open to the possibility of encountering unexpected humor and delight amidst the charts and figures, for within the realm of statistics lies the potential for a sly wink and a clever pun to accompany the pursuit of knowledge and insight.
[[RESULTS]]
The analysis of the connection between Google searches for 'who is Elon Musk' and the stock price of Lululemon Athletica Inc. (LULU) yielded some intriguing findings. As we followed the ebbs and flows of public curiosity about the enigmatic Elon Musk and the lively trajectory of Lululemon's stock price, we discovered a remarkably strong correlation. The correlation coefficient of 0.9677452 suggests a striking association between these seemingly unrelated variables, with an r-squared of 0.9365309 further bolstering our confidence in the robustness of this connection. To add a cherry on top of these compelling statistics, the p-value of less than 0.01 puts any doubts about the significance of this link to rest.
The visual representation of this enthralling association is captured in Figure 1, a scatterplot that portrays the robust and unmistakable relationship between the two variables. The scatterplot itself tells a tale of whimsy and wonder, as the peaks and valleys of public curiosity about Elon Musk mirror the vivacious movements of Lululemon’s stock price. The lighthearted dance between these variables may give the impression that stock prices have a mind of their own, whimsically following the fervor to uncover the mysteries of Elon Musk.
This unexpected correlation prompts us to recognize the playful potential and capricious nature of market movements. While the initial premise of this investigation may have raised a few eyebrows, the empirical evidence certainly puts a smile on our faces, as we navigate the spirited landscape of market dynamics with a renewed appreciation for the unexpected quirks that statistics and data can uncover. The implications of this revelatory finding beckon us to ponder the mirthful musings of statistics and the delightful dalliances of market behavior, with a newfound appreciation for the levity that can permeate financial research.
-------
Your response should start like this:
[[CONCLUSION]]
ChatGPT:
[[CONCLUSION]]
The prodigious correlation unearthed between Google searches for 'who is Elon Musk' and Lululemon's stock price has left us simultaneously astounded and bemused. The robust association, evidenced by a correlation coefficient of 0.9677452 and a p-value of less than 0.01, is a testament to the whimsical wonders of market dynamics. It appears that as the public clamors to decipher the enigma that is Elon Musk, Lululemon's stock price embarks on a merry jaunt of its own, illustrating a delightful dance of curiosity and commerce.
This serendipitous finding encourages us to reconsider the mischievous machinations of the market and the capricious caperings of consumer curiosity. As we behold the scatterplot depicting this gleeful correlation, one cannot help but appreciate the zesty zing of statistical discovery and the playful puns the data seem to play on us mere mortals. The lively movements of Lululemon's stock price in response to public curiosity about Elon Musk evoke a sense of delight seldom encountered in the rigors of financial research.
In light of these jocular revelations, it is clear that no further research is needed in this area. For, to paraphrase Shakespeare, there are more things in heaven and earth, Elon Musk, than are dreamt of in our financial models. Let us chuckle at the quirks and jests statistics can reveal, and bid adieu to this merry pursuit of correlation and causation.
Model: gpt-3.5-turbo-1106
System prompt: You provide fictional names of academic journals. You say nothing else, and you do not chat with the user.
User prompt: Please provide the name of a funny but plausible sounding research, scientific, or academic journal that would publish a paper entited Musk Mystique: Mapping the Mirthful Market Movement with Google Searches for 'Who is Elon Musk' and Lululemon's Lively Stock Price. Respond only with the name of a fictional academic journal.
ChatGPT:
The Journal of Quirky Quantitative Research
Model: gpt-3.5-turbo-1106
System prompt: You provide fictional names of nonprofit research organizations and associations. You say nothing else, and you do not chat with the user.
User prompt: Please provide the name of a funny but plausible sounding nonprofit, academic, or scientific association or organization that would sponsor research that resulted in a paper entited Musk Mystique: Mapping the Mirthful Market Movement with Google Searches for 'Who is Elon Musk' and Lululemon's Lively Stock Price. Respond only with the name of a fictional organization.
ChatGPT:
The Institute for Quirky Consumer Trends Research
Model: gpt-3.5-turbo-1106
System prompt: You provide potential search keywords separated by commas. You say nothing else, and you do not chat with the user.
User prompt: Please provide potential search keywords for a paper titled Musk Mystique: Mapping the Mirthful Market Movement with Google Searches for 'Who is Elon Musk' and Lululemon's Lively Stock Price with an abstract of This paper delves into the delightful dance between online curiosity about Elon Musk and the stock performance of athletic apparel purveyor Lululemon Athletica Inc. (LULU). Leveraging data from Google Trends and LSEG Analytics (Refinitiv), we conducted a comprehensive analysis spanning from 2008 to 2023. Our findings reveal a striking correlation coefficient of 0.9677452, with a p-value of less than 0.01. It seems that as the public's eagerness to unravel the enigmatic enigma of Elon Musk peaks, Lululemon's stock price performs a lively two-step of its own. The implications of this whimsical association prompt further investigation into the waggish whims of the market and the capricious caperings of consumer curiosity.
ChatGPT:
"Elon Musk Google search trends", "Lululemon stock price correlation", "LSEG Analytics data analysis", "Consumer curiosity and stock performance", "Google Trends for 'Who is Elon Musk'", "Lululemon Athletica stock movement", "Market movement and online curiosity", "Enigmatic enigma of Elon Musk", "Stock price correlation coefficient", "Eagerness to unravel Elon Musk", "Capricious caperings of consumer curiosity"
*There is a bunch of Python happening behind the scenes to turn this prompt sequence into a PDF.
Discover a new correlation
View all correlations
View all research papers
Report an error
Data details
Google searches for 'who is elon musk'Detailed data title: Relative volume of Google searches for 'who is elon musk' (Worldwide, without quotes)
Source: Google Trends
Additional Info: Relative search volume (not absolute numbers)
See what else correlates with Google searches for 'who is elon musk'
Lululemon's stock price (LULU)
Detailed data title: Opening price of Lululemon Athletica (LULU) on the first trading day of the year
Source: LSEG Analytics (Refinitiv)
Additional Info: Via Microsoft Excel Stockhistory function
See what else correlates with Lululemon's stock price (LULU)
Correlation is a measure of how much the variables move together. If it is 0.99, when one goes up the other goes up. If it is 0.02, the connection is very weak or non-existent. If it is -0.99, then when one goes up the other goes down. If it is 1.00, you probably messed up your correlation function.
r2 = 0.9365309 (Coefficient of determination)
This means 93.7% of the change in the one variable (i.e., Lululemon's stock price (LULU)) is predictable based on the change in the other (i.e., Google searches for 'who is elon musk') over the 16 years from 2008 through 2023.
p < 0.01, which is statistically significant(Null hypothesis significance test)
The p-value is 8.9E-10. 0.0000000008942960020483061000
The p-value is a measure of how probable it is that we would randomly find a result this extreme. More specifically the p-value is a measure of how probable it is that we would randomly find a result this extreme if we had only tested one pair of variables one time.
But I am a p-villain. I absolutely did not test only one pair of variables one time. I correlated hundreds of millions of pairs of variables. I threw boatloads of data into an industrial-sized blender to find this correlation.
Who is going to stop me? p-value reporting doesn't require me to report how many calculations I had to go through in order to find a low p-value!
On average, you will find a correaltion as strong as 0.97 in 8.9E-8% of random cases. Said differently, if you correlated 1,118,197,999 random variables You don't actually need 1 billion variables to find a correlation like this one. I don't have that many variables in my database. You can also correlate variables that are not independent. I do this a lot.
p-value calculations are useful for understanding the probability of a result happening by chance. They are most useful when used to highlight the risk of a fluke outcome. For example, if you calculate a p-value of 0.30, the risk that the result is a fluke is high. It is good to know that! But there are lots of ways to get a p-value of less than 0.01, as evidenced by this project.
In this particular case, the values are so extreme as to be meaningless. That's why no one reports p-values with specificity after they drop below 0.01.
Just to be clear: I'm being completely transparent about the calculations. There is no math trickery. This is just how statistics shakes out when you calculate hundreds of millions of random correlations.
with the same 15 degrees of freedom, Degrees of freedom is a measure of how many free components we are testing. In this case it is 15 because we have two variables measured over a period of 16 years. It's just the number of years minus ( the number of variables minus one ), which in this case simplifies to the number of years minus one.
you would randomly expect to find a correlation as strong as this one.
[ 0.91, 0.99 ] 95% correlation confidence interval (using the Fisher z-transformation)
The confidence interval is an estimate the range of the value of the correlation coefficient, using the correlation itself as an input. The values are meant to be the low and high end of the correlation coefficient with 95% confidence.
This one is a bit more complciated than the other calculations, but I include it because many people have been pushing for confidence intervals instead of p-value calculations (for example: NEJM. However, if you are dredging data, you can reliably find yourself in the 5%. That's my goal!
All values for the years included above: If I were being very sneaky, I could trim years from the beginning or end of the datasets to increase the correlation on some pairs of variables. I don't do that because there are already plenty of correlations in my database without monkeying with the years.
Still, sometimes one of the variables has more years of data available than the other. This page only shows the overlapping years. To see all the years, click on "See what else correlates with..." link above.
| 2008 | 2009 | 2010 | 2011 | 2012 | 2013 | 2014 | 2015 | 2016 | 2017 | 2018 | 2019 | 2020 | 2021 | 2022 | 2023 | |
| Google searches for 'who is elon musk' (Rel. search volume) | 0.0909091 | 0.111111 | 0 | 0 | 0 | 0.75 | 1 | 1.58333 | 1.66667 | 3.66667 | 8.41667 | 6.08333 | 15.4167 | 26.3333 | 43 | 26.8889 |
| Lululemon's stock price (LULU) (Stock price) | 23.7 | 3.98 | 15.44 | 34.7 | 47.5 | 77.73 | 59.08 | 56.01 | 53.71 | 65.94 | 77.31 | 118.89 | 232.9 | 351.67 | 392.2 | 326.88 |
Why this works
- Data dredging: I have 25,153 variables in my database. I compare all these variables against each other to find ones that randomly match up. That's 632,673,409 correlation calculations! This is called “data dredging.” Instead of starting with a hypothesis and testing it, I instead abused the data to see what correlations shake out. It’s a dangerous way to go about analysis, because any sufficiently large dataset will yield strong correlations completely at random.
- Lack of causal connection: There is probably
Because these pages are automatically generated, it's possible that the two variables you are viewing are in fact causually related. I take steps to prevent the obvious ones from showing on the site (I don't let data about the weather in one city correlate with the weather in a neighboring city, for example), but sometimes they still pop up. If they are related, cool! You found a loophole.
no direct connection between these variables, despite what the AI says above. This is exacerbated by the fact that I used "Years" as the base variable. Lots of things happen in a year that are not related to each other! Most studies would use something like "one person" in stead of "one year" to be the "thing" studied. - Observations not independent: For many variables, sequential years are not independent of each other. If a population of people is continuously doing something every day, there is no reason to think they would suddenly change how they are doing that thing on January 1. A simple
Personally I don't find any p-value calculation to be 'simple,' but you know what I mean.
p-value calculation does not take this into account, so mathematically it appears less probable than it really is.
Try it yourself
You can calculate the values on this page on your own! Try running the Python code to see the calculation results. Step 1: Download and install Python on your computer.Step 2: Open a plaintext editor like Notepad and paste the code below into it.
Step 3: Save the file as "calculate_correlation.py" in a place you will remember, like your desktop. Copy the file location to your clipboard. On Windows, you can right-click the file and click "Properties," and then copy what comes after "Location:" As an example, on my computer the location is "C:\Users\tyler\Desktop"
Step 4: Open a command line window. For example, by pressing start and typing "cmd" and them pressing enter.
Step 5: Install the required modules by typing "pip install numpy", then pressing enter, then typing "pip install scipy", then pressing enter.
Step 6: Navigate to the location where you saved the Python file by using the "cd" command. For example, I would type "cd C:\Users\tyler\Desktop" and push enter.
Step 7: Run the Python script by typing "python calculate_correlation.py"
If you run into any issues, I suggest asking ChatGPT to walk you through installing Python and running the code below on your system. Try this question:
"Walk me through installing Python on my computer to run a script that uses scipy and numpy. Go step-by-step and ask me to confirm before moving on. Start by asking me questions about my operating system so that you know how to proceed. Assume I want the simplest installation with the latest version of Python and that I do not currently have any of the necessary elements installed. Remember to only give me one step per response and confirm I have done it before proceeding."
# These modules make it easier to perform the calculation
import numpy as np
from scipy import stats

# We'll define a function that we can call to return the correlation calculations
def calculate_correlation(array1, array2):

    # Calculate Pearson correlation coefficient and p-value
    correlation, p_value = stats.pearsonr(array1, array2)

    # Calculate R-squared as the square of the correlation coefficient
    r_squared = correlation**2

    return correlation, r_squared, p_value

# These are the arrays for the variables shown on this page, but you can modify them to be any two sets of numbers
array_1 = np.array([0.0909091,0.111111,0,0,0,0.75,1,1.58333,1.66667,3.66667,8.41667,6.08333,15.4167,26.3333,43,26.8889,])
array_2 = np.array([23.7,3.98,15.44,34.7,47.5,77.73,59.08,56.01,53.71,65.94,77.31,118.89,232.9,351.67,392.2,326.88,])
array_1_name = "Google searches for 'who is elon musk'"
array_2_name = "Lululemon's stock price (LULU)"

# Perform the calculation
print(f"Calculating the correlation between {array_1_name} and {array_2_name}...")
correlation, r_squared, p_value = calculate_correlation(array_1, array_2)

# Print the results
print("Correlation Coefficient:", correlation)
print("R-squared:", r_squared)
print("P-value:", p_value)
Reuseable content
You may re-use the images on this page for any purpose, even commercial purposes, without asking for permission. The only requirement is that you attribute Tyler Vigen. Attribution can take many different forms. If you leave the "tylervigen.com" link in the image, that satisfies it just fine. If you remove it and move it to a footnote, that's fine too. You can also just write "Charts courtesy of Tyler Vigen" at the bottom of an article.You do not need to attribute "the spurious correlations website," and you don't even need to link here if you don't want to. I don't gain anything from pageviews. There are no ads on this site, there is nothing for sale, and I am not for hire.
For the record, I am just one person. Tyler Vigen, he/him/his. I do have degrees, but they should not go after my name unless you want to annoy my wife. If that is your goal, then go ahead and cite me as "Tyler Vigen, A.A. A.A.S. B.A. J.D." Otherwise it is just "Tyler Vigen."
When spoken, my last name is pronounced "vegan," like I don't eat meat.
Full license details.
For more on re-use permissions, or to get a signed release form, see tylervigen.com/permission.
Download images for these variables:
- High resolution line chart
The image linked here is a Scalable Vector Graphic (SVG). It is the highest resolution that is possible to achieve. It scales up beyond the size of the observable universe without pixelating. You do not need to email me asking if I have a higher resolution image. I do not. The physical limitations of our universe prevent me from providing you with an image that is any higher resolution than this one.
If you insert it into a PowerPoint presentation (a tool well-known for managing things that are the scale of the universe), you can right-click > "Ungroup" or "Create Shape" and then edit the lines and text directly. You can also change the colors this way.
Alternatively you can use a tool like Inkscape. - High resolution line chart, optimized for mobile
- Alternative high resolution line chart
- Scatterplot
- Portable line chart (png)
- Portable line chart (png), optimized for mobile
- Line chart for only Google searches for 'who is elon musk'
- Line chart for only Lululemon's stock price (LULU)
- AI-generated correlation image
- The spurious research paper: Musk Mystique: Mapping the Mirthful Market Movement with Google Searches for 'Who is Elon Musk' and Lululemon's Lively Stock Price
Your correlation rating is out of this world!
Correlation ID: 1637 · Black Variable ID: 1487 · Red Variable ID: 1735

