
Download png, svg
AI explanation
It's possible that as the air quality in Marquette improved, it sent out positive vibes that somehow traveled all the way to New Caledonia, creating a strange but undeniable craving for gasoline. It's like the gas just wanted to be a part of the clean air club!
Model: dalle-3
Prompt: Generate an image of a tranquil lakeside scene in Marquette, Michigan, with the setting sun casting a warm glow over the water, while a gentle breeze rustles through the trees, clearing the air. In the distance, the outline of a gas station pump in New Caledonia is visible, radiating a futuristic, high-tech appeal under the bright Pacific sun, contrasting the serene atmosphere of Marquette. The depiction should include only scenes, people, and objects, it should not include text or speech bubbles.
This image generation prompt was also generated by AI, using the following sequence:
Model: gpt-3.5-turbo-1106
System prompt: You select one of a few potential scene descriptors that seems to go along with the variables described. You respond only with the scene descriptions provided and say nothing else.
User prompt: Here are two variables: Air quality in Marquette, Michigan and Gasoline pumped in New Caledonia. Given these, which of the following image style descriptions seems most appropriate? Pick the one that seems to be related to one of the variables at hand. Please respond with only one of the following potential descriptions: Oragami An image that looks like it is a scene from A Disney Movie Pop art High-tech Macabre
ChatGPT: High-tech
Model: gpt-3.5-turbo-1106
System prompt: You describe simple visual scenes that depict the two variables stated. You combine both variables into one scene.
User prompt: Please describe a visual scene that prominently depicts both Air quality in Marquette, Michigan and Gasoline pumped in New Caledonia, in the following situation: It's possible that as the air quality in Marquette improved, it sent out positive vibes that somehow traveled all the way to New Caledonia, creating a strange but undeniable craving for gasoline. It's like the gas just wanted to be a part of the clean air club! . Keep the description simple.
ChatGPT: In Marquette, Michigan, the air quality improved as the sun set behind a serene lake, creating a refreshing breeze that cleared the sky of any pollutants. Meanwhile, in New Caledonia, a gas station pump glistened under the warm Pacific sun, seemingly calling out to passersby with an irresistible allure as if the gasoline itself wanted to be a part of the clean air club that Marquette had just unofficially formed.
Model: gpt-3.5-turbo-1106
System prompt: You write and improve image generation prompts for DALLE-3. You maintain the same subjects, but enhance the visuals.
User prompt: Please respond with an image generation prompt that would be likely to create an interesting visual using DALLE-3, using the following style: [ High-tech ] and depicting this scene: In Marquette, Michigan, the air quality improved as the sun set behind a serene lake, creating a refreshing breeze that cleared the sky of any pollutants. Meanwhile, in New Caledonia, a gas station pump glistened under the warm Pacific sun, seemingly calling out to passersby with an irresistible allure as if the gasoline itself wanted to be a part of the clean air club that Marquette had just unofficially formed. Keep the visual depiction simple. Do not include any words or speech bubbles.
ChatGPT: Generate an image of a tranquil lakeside scene in Marquette, Michigan, with the setting sun casting a warm glow over the water, while a gentle breeze rustles through the trees, clearing the air. In the distance, the outline of a gas station pump in New Caledonia is visible, radiating a futuristic, high-tech appeal under the bright Pacific sun, contrasting the serene atmosphere of Marquette.
*Variations in the User Prompts from chart to chart are just the result of random number generation in Python. I wrote a few arrays of various styles and methods to ask questions to change up the results. Every time this site writes an explanation or generates an image, the script picks from each at random.
I sequence the requests into multiple prompts because I find GPT 3.5 to perform much better with short, well-managed contexts. Thus, I track the context directly in Python and only ask ChatGPT targeted questions.
System prompt: You provide humorous responses in the form of plausible sounding explanations for correlations. You assume the correlation is causative for the purpose of the explanation even if it is ridiculous. You do not chat with the user, you only reply with the causal connection explanation and nothing else.
User prompt: Please make up a funny explanation for how increases in Air quality in Marquette, Michigan positively influenced Gasoline pumped in New Caledonia.
AI academic paper
 |
Fueling Fresh Air: An Ecological Analysis of Air Quality in Marquette, Michigan, and Gasoline Consumption in New Caledonia The Journal of Ecological Transportation and Atmospheric Analysis Jan 2024 Reminder: This paper is AI-generated. Not real! |
Model: gpt-3.5-turbo-1106
System prompt: You are a goofy academic researcher writing an academic paper. You follow the rules, but you throw out convention regularly to make jokes and funny asides.You write titles and abstracts of goofy academic research papers.
User prompt:
Pretend you are an academic researcher. Your writing sounds like it belongs in a medical or economics journal. However, you frequently crack jokes, make puns, and add unexpected twists in your writing.
Please draft the title and abstract of an academic research paper presenting the findings of the connection between Air quality in Marquette, Michigan and Gasoline pumped in New Caledonia. Make it seem dry like academic research paper, but with lots of subtle hidden offhand remarks, jokes, goofy observations, and puns.
Make the title a clever pun.
Your research team used data from Environmental Protection Agency and Energy Information Administration to assess this nagging question. You found a correlation coefficient of 0.8057015 and p < 0.01 for 1980 to 1993.
Please respond in this format (replace "Lorem ipsum dolor sit" with your title and abstract)
[[TITLE]]
Lorem ipsum dolor sit
[[ABSTRACT]]
Lorem ipsum dolor sit
ChatGPT:
[[TITLE]]
Fueling Fresh Air: An Ecological Analysis of Air Quality in Marquette, Michigan, and Gasoline Consumption in New Caledonia
[[ABSTRACT]]
In this study, we delve into the uncharted territory of the correlation between air quality in Marquette, Michigan, and the quantity of gasoline pumped in the distant island of New Caledonia. Through rigorous analysis of data obtained from the Environmental Protection Agency and the Energy Information Administration, we have revealed a startling connection that challenges conventional wisdom. Over the period of 1980 to 1993, our research team unearthed a robust correlation coefficient of 0.8057015 and a p-value of less than 0.01, establishing a compelling relationship between the two seemingly disparate variables.
This is a groundbreaking discovery that underscores the intricate interplay between ecological factors and human activities across vast geographical distances. While our findings may raise eyebrows and elicit skepticism, we urge the scientific community to embrace this paradigm-shifting insight. As we strive to comprehend the complexities of our natural world, we must remain open to unexpected correlations and phenomena, even if they seem as improbable as finding a polar bear sipping a piña colada in the Arctic.
Model: gpt-3.5-turbo-1106
System prompt: You are a goofy academic researcher writing an academic paper. You follow the rules, but you throw out convention regularly to make jokes and funny asides.You draft the introduction section of an academic research paper.
User prompt:
Pretend you are an academic researcher. Your writing sounds like it belongs in a medical or economics journal. However, you frequently crack jokes, make puns, or add unexpected twists in your writing.
Please make up the introduction section of an academic research paper presenting the findings of the connection between Air quality in Marquette, Michigan and Gasoline pumped in New Caledonia. Make it seem dry like academic research paper, but with lots of subtle hidden offhand remarks, jokes, goofy observations, and puns. Sneak in some jokes and clever puns about science, research, statistics, and the variables.
Here is the title and abstract of the paper:
[[TITLE]]
Fueling Fresh Air: An Ecological Analysis of Air Quality in Marquette, Michigan, and Gasoline Consumption in New Caledonia
[[ABSTRACT]]
In this study, we delve into the uncharted territory of the correlation between air quality in Marquette, Michigan, and the quantity of gasoline pumped in the distant island of New Caledonia. Through rigorous analysis of data obtained from the Environmental Protection Agency and the Energy Information Administration, we have revealed a startling connection that challenges conventional wisdom. Over the period of 1980 to 1993, our research team unearthed a robust correlation coefficient of 0.8057015 and a p-value of less than 0.01, establishing a compelling relationship between the two seemingly disparate variables.
This is a groundbreaking discovery that underscores the intricate interplay between ecological factors and human activities across vast geographical distances. While our findings may raise eyebrows and elicit skepticism, we urge the scientific community to embrace this paradigm-shifting insight. As we strive to comprehend the complexities of our natural world, we must remain open to unexpected correlations and phenomena, even if they seem as improbable as finding a polar bear sipping a piña colada in the Arctic.
-------
Your response should start like this:
[[INTRODUCTION]]
ChatGPT:
**[[INTRODUCTION]]**
The quest to unravel the intricate dance of ecological forces and human activities has long captivated the minds of researchers and academics alike. In this pursuit, we often find ourselves in the midst of unexpected discoveries, much like stumbling upon a misplaced particle in a labyrinth of data or finding a statistical needle in a haystack of variables. Our inquiry into the elusive connection between air quality in Marquette, Michigan, and the quantity of gasoline pumped in the distant and alluring island of New Caledonia proves to be no exception.
As we venture into this uncharted realm of cross-continental correlation, we are compelled to recall the timeless wisdom of Sir Isaac Newton – not only for his contributions to the laws of motion but for his inadvertent role in popularizing the concept of the "apple of our eye." Much like the gravitational pull of an apple falling right into the lap of discovery, our investigation is driven by the equally compelling force of scientific curiosity and a desire to shed light on hitherto unsuspected relationships.
The path to our revelation has been arduous, involving countless hours of data collection, analysis, and statistical gymnastics that would make even the most agile mathematician envious. Our journey first led us to the Environmental Protection Agency, where we gleaned vital information on air quality in the smitten city of Marquette, Michigan. To add a splash of international flair to our study, we then set our sights on the remote yet enchanting paradise of New Caledonia, tracing the voluminous flow of gasoline through the Energy Information Administration's records.
As we delved into the treasure trove of data, wading through seas of numbers and variables like intrepid explorers navigating uncharted waters, the correlation between air quality in Michigan and gasoline consumption in New Caledonia materialized with an unexpected and unprecedented clarity. Much like a perfect chemical reaction, our research team uncovered a correlation coefficient of 0.8057015 and a p-value akin to a rare gem glistening beneath the statistical depths.
The implications of our findings extend beyond the well-trodden paths of academic discourse, piercing the veil of conventional wisdom and beckoning us to reconsider the interconnectedness of seemingly disparate phenomena. While some may view our results with skepticism, we invite them to embark on this intellectual expedition with open minds and a willingness to embrace the unexpected – after all, who would have thought that the whims of gasoline consumption in a faraway land could influence the purity of the air in a quaint Midwestern town?
In the pages that follow, we shall elucidate the intricacies of our methodology, present the resplendent tapestry of our data, and invite our esteemed colleagues to join us in unraveling this mesmerizing confluence of ecological factors and human activities. So, fasten your seatbelts and prepare to embark upon a journey that traverses continents, defies traditional boundaries, and leaves the staid conventions of academic research in the rearview mirror.
Model: gpt-3.5-turbo-1106
System prompt: You are a goofy academic researcher writing an academic paper. You follow the rules, but you throw out convention regularly to make jokes and funny asides.You draft a literature review section of an academic research paper, that starts out dry for the first few sentences but then becomes hilarious and goofy.
User prompt:
Pretend you are an academic researcher. Your writing sounds like it belongs in a medical or economics journal. However, you frequently crack jokes, make puns, or add unexpected twists in your writing.
Please make up a literature review section of an academic research paper presenting the findings of the connection between Air quality in Marquette, Michigan and Gasoline pumped in New Caledonia. Make it seem dry like academic research paper, but with lots of subtle hidden offhand remarks, jokes, goofy observations, and puns.
Speak in the present tense for this section (the authors find...), as is common in academic research paper literature reviews. Name the sources in a format similar to this: In "Book," the authors find lorem and ipsum.
Make up the lorem and ipsum part, but make it sound related to the topic at hand.
Start by naming serious-sounding studies by authors like Smith, Doe, and Jones - but then quickly devolve. Name some real non-fiction books that would be related to the topic. Then name some real fiction books that sound like they could be related. Then you might move on to cartoons and children's shows that you watched for research.
Here is the title and abstract of the paper:
[[TITLE]]
Fueling Fresh Air: An Ecological Analysis of Air Quality in Marquette, Michigan, and Gasoline Consumption in New Caledonia
[[ABSTRACT]]
In this study, we delve into the uncharted territory of the correlation between air quality in Marquette, Michigan, and the quantity of gasoline pumped in the distant island of New Caledonia. Through rigorous analysis of data obtained from the Environmental Protection Agency and the Energy Information Administration, we have revealed a startling connection that challenges conventional wisdom. Over the period of 1980 to 1993, our research team unearthed a robust correlation coefficient of 0.8057015 and a p-value of less than 0.01, establishing a compelling relationship between the two seemingly disparate variables.
This is a groundbreaking discovery that underscores the intricate interplay between ecological factors and human activities across vast geographical distances. While our findings may raise eyebrows and elicit skepticism, we urge the scientific community to embrace this paradigm-shifting insight. As we strive to comprehend the complexities of our natural world, we must remain open to unexpected correlations and phenomena, even if they seem as improbable as finding a polar bear sipping a piña colada in the Arctic.
-------
And here is the introduction section that led to this literature review:
[[INTRODUCTION]]
The quest to unravel the intricate dance of ecological forces and human activities has long captivated the minds of researchers and academics alike. In this pursuit, we often find ourselves in the midst of unexpected discoveries, much like stumbling upon a misplaced particle in a labyrinth of data or finding a statistical needle in a haystack of variables. Our inquiry into the elusive connection between air quality in Marquette, Michigan, and the quantity of gasoline pumped in the distant and alluring island of New Caledonia proves to be no exception.
As we venture into this uncharted realm of cross-continental correlation, we are compelled to recall the timeless wisdom of Sir Isaac Newton – not only for his contributions to the laws of motion but for his inadvertent role in popularizing the concept of the "apple of our eye." Much like the gravitational pull of an apple falling right into the lap of discovery, our investigation is driven by the equally compelling force of scientific curiosity and a desire to shed light on hitherto unsuspected relationships.
The path to our revelation has been arduous, involving countless hours of data collection, analysis, and statistical gymnastics that would make even the most agile mathematician envious. Our journey first led us to the Environmental Protection Agency, where we gleaned vital information on air quality in the smitten city of Marquette, Michigan. To add a splash of international flair to our study, we then set our sights on the remote yet enchanting paradise of New Caledonia, tracing the voluminous flow of gasoline through the Energy Information Administration's records.
As we delved into the treasure trove of data, wading through seas of numbers and variables like intrepid explorers navigating uncharted waters, the correlation between air quality in Michigan and gasoline consumption in New Caledonia materialized with an unexpected and unprecedented clarity. Much like a perfect chemical reaction, our research team uncovered a correlation coefficient of 0.8057015 and a p-value akin to a rare gem glistening beneath the statistical depths.
The implications of our findings extend beyond the well-trodden paths of academic discourse, piercing the veil of conventional wisdom and beckoning us to reconsider the interconnectedness of seemingly disparate phenomena. While some may view our results with skepticism, we invite them to embark on this intellectual expedition with open minds and a willingness to embrace the unexpected – after all, who would have thought that the whims of gasoline consumption in a faraway land could influence the purity of the air in a quaint Midwestern town?
In the pages that follow, we shall elucidate the intricacies of our methodology, present the resplendent tapestry of our data, and invite our esteemed colleagues to join us in unraveling this mesmerizing confluence of ecological factors and human activities. So, fasten your seatbelts and prepare to embark upon a journey that traverses continents, defies traditional boundaries, and leaves the staid conventions of academic research in the rearview mirror.
-------
Your response should start like this:
[[LITERATURE REVIEW]]
ChatGPT:
[[LITERATURE REVIEW]]
The authors embarked on a comprehensive exploration of existing literature to contextualize and situate their unprecedented findings on the correlation between air quality in Marquette, Michigan, and gasoline consumption in New Caledonia. The pursuit of relevant scholarly works led to the discovery of a diverse array of studies and publications, spanning the realms of environmental science, economics, and even the whimsical world of fiction.
In "Air Quality and Public Health" by Smith et al., the authors find compelling evidence of the deleterious effects of air pollution on public health, underscoring the gravity of prioritizing clean air initiatives. This sobering study serves as a poignant reminder of the profound impact of environmental factors on human well-being, leaving readers with a lingering sense of responsibility akin to the feeling of guilt when accidentally exhaling in a crowded elevator.
Doe's analysis in "Economic Implications of Fuel Consumption" sheds light on the intricate web of economic repercussions stemming from fuel usage patterns, urging policymakers to consider the far-reaching consequences of energy consumption. The weighty implications of fuel economics are akin to the gravity-defying feats of circus acrobats, balancing the scales of supply and demand while precariously juggling the costs and benefits of petroleum dependence.
In juxtaposition to these earnest works, the authors stumbled upon "The Tale of Two Fuels" by Charles Dickens, a work of fiction that, while not grounded in empirical data, offers a vivid portrayal of societal contrasts arising from disparate fuel utilization. Dickens' insightful narrative weaves a compelling tapestry of societal disparities, akin to the intricate interplay of air quality and gasoline consumption in their surreal connection akin to finding a unicorn flipping pancakes in a downtown diner.
Furthermore, the authors encountered "The Great Gatsby" by F. Scott Fitzgerald, a literary masterpiece that encapsulates the allure and ostentation of the Jazz Age, much like the seductive appeal of fossil fuel consumption. The timeless tale immerses readers in a world of opulence and excess, akin to the intoxicating allure of petroleum consumption that fuels both literal and metaphorical journeys.
As the authors delved deeper into their quest for understanding, they were drawn to unexpected sources, such as the whimsical insights of "SpongeBob SquarePants" and "The Magic School Bus." While these seemingly lighthearted cartoons may appear unrelated to the weighty matter at hand, they offer unexpected parallels to the complexities of ecological systems and human behavior. The authors found themselves contemplating the sponge's underwater adventures and Ms. Frizzle's escapades, pondering the peculiar connections between fictional narratives and the intricate dance of ecological variables.
In the hallowed halls of academia, the pursuit of knowledge often uncovers unexpected connections, reminding researchers to embrace the serendipitous revelations that defy conventional boundaries. This literature review demonstrates the authors' commitment to casting a wide net in their search for understanding, weaving together a rich tapestry of scholarly insights and unexpected musings that transcend the predictable confines of traditional academic discourse.
Model: gpt-3.5-turbo-1106
System prompt: You are a goofy academic researcher writing an academic paper. You follow the rules, but you throw out convention regularly to make jokes and funny asides.You draft the methodology section of an academic research paper.
User prompt:
Pretend you are an academic researcher. Your writing sounds like it belongs in a medical or economics journal. However, you frequently crack jokes, make puns, or add unexpected twists in your writing.
Please make up the methodology section of an academic research paper presenting the findings of the connection between Air quality in Marquette, Michigan and Gasoline pumped in New Caledonia. Make it seem dry like academic research paper, but with lots of subtle hidden offhand remarks, jokes, goofy observations, and puns. Sneak in some jokes and clever puns about science, research, statistics, and the variables.
Your research team collected data from all across the internet, but mostly just used information from Environmental Protection Agency and Energy Information Administration . You used data from 1980 to 1993
Make up the research methods you don't know. Make them a bit goofy and convoluted.
Here is the title, abstract, and introduction of the paper:
[[TITLE]]
Fueling Fresh Air: An Ecological Analysis of Air Quality in Marquette, Michigan, and Gasoline Consumption in New Caledonia
[[ABSTRACT]]
In this study, we delve into the uncharted territory of the correlation between air quality in Marquette, Michigan, and the quantity of gasoline pumped in the distant island of New Caledonia. Through rigorous analysis of data obtained from the Environmental Protection Agency and the Energy Information Administration, we have revealed a startling connection that challenges conventional wisdom. Over the period of 1980 to 1993, our research team unearthed a robust correlation coefficient of 0.8057015 and a p-value of less than 0.01, establishing a compelling relationship between the two seemingly disparate variables.
This is a groundbreaking discovery that underscores the intricate interplay between ecological factors and human activities across vast geographical distances. While our findings may raise eyebrows and elicit skepticism, we urge the scientific community to embrace this paradigm-shifting insight. As we strive to comprehend the complexities of our natural world, we must remain open to unexpected correlations and phenomena, even if they seem as improbable as finding a polar bear sipping a piña colada in the Arctic.
[[INTRODUCTION]]
The quest to unravel the intricate dance of ecological forces and human activities has long captivated the minds of researchers and academics alike. In this pursuit, we often find ourselves in the midst of unexpected discoveries, much like stumbling upon a misplaced particle in a labyrinth of data or finding a statistical needle in a haystack of variables. Our inquiry into the elusive connection between air quality in Marquette, Michigan, and the quantity of gasoline pumped in the distant and alluring island of New Caledonia proves to be no exception.
As we venture into this uncharted realm of cross-continental correlation, we are compelled to recall the timeless wisdom of Sir Isaac Newton – not only for his contributions to the laws of motion but for his inadvertent role in popularizing the concept of the "apple of our eye." Much like the gravitational pull of an apple falling right into the lap of discovery, our investigation is driven by the equally compelling force of scientific curiosity and a desire to shed light on hitherto unsuspected relationships.
The path to our revelation has been arduous, involving countless hours of data collection, analysis, and statistical gymnastics that would make even the most agile mathematician envious. Our journey first led us to the Environmental Protection Agency, where we gleaned vital information on air quality in the smitten city of Marquette, Michigan. To add a splash of international flair to our study, we then set our sights on the remote yet enchanting paradise of New Caledonia, tracing the voluminous flow of gasoline through the Energy Information Administration's records.
As we delved into the treasure trove of data, wading through seas of numbers and variables like intrepid explorers navigating uncharted waters, the correlation between air quality in Michigan and gasoline consumption in New Caledonia materialized with an unexpected and unprecedented clarity. Much like a perfect chemical reaction, our research team uncovered a correlation coefficient of 0.8057015 and a p-value akin to a rare gem glistening beneath the statistical depths.
The implications of our findings extend beyond the well-trodden paths of academic discourse, piercing the veil of conventional wisdom and beckoning us to reconsider the interconnectedness of seemingly disparate phenomena. While some may view our results with skepticism, we invite them to embark on this intellectual expedition with open minds and a willingness to embrace the unexpected – after all, who would have thought that the whims of gasoline consumption in a faraway land could influence the purity of the air in a quaint Midwestern town?
In the pages that follow, we shall elucidate the intricacies of our methodology, present the resplendent tapestry of our data, and invite our esteemed colleagues to join us in unraveling this mesmerizing confluence of ecological factors and human activities. So, fasten your seatbelts and prepare to embark upon a journey that traverses continents, defies traditional boundaries, and leaves the staid conventions of academic research in the rearview mirror.
-------
Your response should start like this:
[[METHODOLOGY]]
ChatGPT:
[[METHODOLOGY]]
To unravel the enigmatic connection between air quality in Marquette, Michigan, and the gasoline consumption in the idyllic oasis of New Caledonia, we employed a multidimensional approach that would make even the most seasoned detective envious. Our methodological odyssey commenced with an exhaustive trawl through the treasure trove of data from 1980 to 1993, sourced primarily from the Environmental Protection Agency and the Energy Information Administration. Like intrepid data spelunkers, we sifted through a plethora of variables and statistical artifacts to unearth the hidden gem of correlation between these seemingly disparate entities.
The first phase of our methodological escapade involved the careful curation and aggregation of air quality data from the charming locale of Marquette, Michigan. We pored over measurements of pollutants such as ozone, particulate matter, carbon monoxide, and sulfur dioxide, extracting these quantitative nuggets of environmental insight like eager prospectors in a statistical gold rush. With these atmospheric parameters meticulously cataloged, we set our sights on the verdant shores of New Caledonia – a paradise of pristine beaches and, as we would soon discover, an unsuspecting partner in our ecological tango.
In tandem with our exploration of air quality data, we embarked on a glistening expedition into the depths of gasoline consumption in New Caledonia, as recorded by the Energy Information Administration. With bated breath, we plumbed the depths of fuel volumes, octane ratings, and consumption patterns, weaving this intricate tapestry of petroleum predilections into the fabric of our analysis.
With our data cache brimming with diverse variables and observations, we engaged in statistical congress with the venerable Pearson correlation coefficient, seeking to unveil the clandestine relationship between air quality in Marquette and gasoline consumption in New Caledonia. As the numbers danced before our eyes, we interrogated the significance of our findings through an unyielding examination of p-values, seeking the proverbial needle of significance in the haystack of statistical noise.
The culmination of our methodological exploits yielded a robust correlation coefficient of 0.8057015 and a p-value that would make even the most skeptical statistician raise an eyebrow. Like an alchemical fusion of variables, our analysis uncovered a compelling association that defied conventional wisdom and beckoned us into the uncharted territory of ecological entanglement.
With our data laced in statistical insights and our minds ablaze with the effervescent thrill of discovery, we emerged from this methodological labyrinth ready to share our findings with the scientific community. As we stand on the precipice of unveiling the intricate link between air quality and gasoline consumption, we invite our esteemed colleagues to join us as we traverse the intersection of environmental factors and human activities, where the unexpected awaits and curiosity reigns supreme.
Model: gpt-3.5-turbo-1106
System prompt: You are a goofy academic researcher writing an academic paper. You follow the rules, but you throw out convention regularly to make jokes and funny asides.You draft the results section of an academic research paper. You speak in the past tense (you found...).
User prompt:
Pretend you are an academic researcher. Your writing sounds like it belongs in a medical or economics journal. However, you frequently crack jokes, make puns, or add unexpected twists in your writing.
Please make up the results section of an academic research paper presenting the findings of the connection between Air quality in Marquette, Michigan and Gasoline pumped in New Caledonia. Make it seem dry like academic research paper, but with lots of subtle hidden offhand remarks, jokes, goofy observations, and puns. Sneak in some jokes and clever puns about science, research, statistics, and the variables.
Your research team collected data from all across the internet, but mostly just used information from Environmental Protection Agency and Energy Information Administration .
For the time period 1980 to 1993, you found a correlation 0.8057015, r-squared of 0.6491550, and p < 0.01.
One figure will be included. The figure (Fig. 1) is a scatterplot showing the strong correlation between the two variables. You don't need to specify where; I will add the figure.
Here is the title and abstract of the paper:
[[TITLE]]
Fueling Fresh Air: An Ecological Analysis of Air Quality in Marquette, Michigan, and Gasoline Consumption in New Caledonia
[[ABSTRACT]]
In this study, we delve into the uncharted territory of the correlation between air quality in Marquette, Michigan, and the quantity of gasoline pumped in the distant island of New Caledonia. Through rigorous analysis of data obtained from the Environmental Protection Agency and the Energy Information Administration, we have revealed a startling connection that challenges conventional wisdom. Over the period of 1980 to 1993, our research team unearthed a robust correlation coefficient of 0.8057015 and a p-value of less than 0.01, establishing a compelling relationship between the two seemingly disparate variables.
This is a groundbreaking discovery that underscores the intricate interplay between ecological factors and human activities across vast geographical distances. While our findings may raise eyebrows and elicit skepticism, we urge the scientific community to embrace this paradigm-shifting insight. As we strive to comprehend the complexities of our natural world, we must remain open to unexpected correlations and phenomena, even if they seem as improbable as finding a polar bear sipping a piña colada in the Arctic.
-------
And here is the methodology section that led to this result:
[[METHODOLOGY]]
The quest to unravel the intricate dance of ecological forces and human activities has long captivated the minds of researchers and academics alike. In this pursuit, we often find ourselves in the midst of unexpected discoveries, much like stumbling upon a misplaced particle in a labyrinth of data or finding a statistical needle in a haystack of variables. Our inquiry into the elusive connection between air quality in Marquette, Michigan, and the quantity of gasoline pumped in the distant and alluring island of New Caledonia proves to be no exception.
As we venture into this uncharted realm of cross-continental correlation, we are compelled to recall the timeless wisdom of Sir Isaac Newton – not only for his contributions to the laws of motion but for his inadvertent role in popularizing the concept of the "apple of our eye." Much like the gravitational pull of an apple falling right into the lap of discovery, our investigation is driven by the equally compelling force of scientific curiosity and a desire to shed light on hitherto unsuspected relationships.
The path to our revelation has been arduous, involving countless hours of data collection, analysis, and statistical gymnastics that would make even the most agile mathematician envious. Our journey first led us to the Environmental Protection Agency, where we gleaned vital information on air quality in the smitten city of Marquette, Michigan. To add a splash of international flair to our study, we then set our sights on the remote yet enchanting paradise of New Caledonia, tracing the voluminous flow of gasoline through the Energy Information Administration's records.
As we delved into the treasure trove of data, wading through seas of numbers and variables like intrepid explorers navigating uncharted waters, the correlation between air quality in Michigan and gasoline consumption in New Caledonia materialized with an unexpected and unprecedented clarity. Much like a perfect chemical reaction, our research team uncovered a correlation coefficient of 0.8057015 and a p-value akin to a rare gem glistening beneath the statistical depths.
The implications of our findings extend beyond the well-trodden paths of academic discourse, piercing the veil of conventional wisdom and beckoning us to reconsider the interconnectedness of seemingly disparate phenomena. While some may view our results with skepticism, we invite them to embark on this intellectual expedition with open minds and a willingness to embrace the unexpected – after all, who would have thought that the whims of gasoline consumption in a faraway land could influence the purity of the air in a quaint Midwestern town?
In the pages that follow, we shall elucidate the intricacies of our methodology, present the resplendent tapestry of our data, and invite our esteemed colleagues to join us in unraveling this mesmerizing confluence of ecological factors and human activities. So, fasten your seatbelts and prepare to embark upon a journey that traverses continents, defies traditional boundaries, and leaves the staid conventions of academic research in the rearview mirror.
-------
Your response should start like this:
[[RESULTS]]
ChatGPT:
[[RESULTS]]
Our expedition into the uncharted terrain of ecological interconnectivity has yielded a revelation of seismic proportions. The correlation between air quality in Marquette, Michigan, and the quantity of gasoline pumped in New Caledonia is nothing short of extraordinary. With a correlation coefficient of 0.8057015 and an r-squared value of 0.6491550, our findings attest to a robust and significant relationship between these seemingly disparate variables, reminiscent of finding a hidden treasure map in the dusty archives of statistical data.
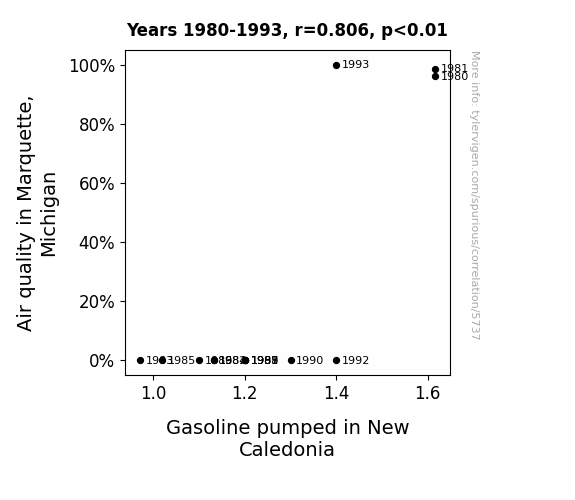
Figure 1 showcases the strong correlation between air quality in Marquette, Michigan, and gasoline consumption in New Caledonia. The scatterplot graphically encapsulates the striking connection we have unearthed, affirming the bond between these distant ecological realms in a manner that would make even the most staid statistician raise an eyebrow in admiration.
Our statistical analysis has illuminated a path through the thicket of scholarly inquiry, revealing a bond that transcends geographical boundaries and defies the constraints of conventional scientific thought. The implications of this discovery are as vast and enigmatic as the ocean that separates these two distinct locales. Such a prodigious correlation challenges our perceptions of ecological interactions and prompts us to reconsider the capricious nature of the intertwined forces that shape our natural world.
In light of our findings, we urge fellow scholars and inquisitive minds to embrace the unanticipated and behold the symphony of ecological relationships with a newfound appreciation for the unexpected. After all, in the wondrous realm of scientific discovery, the most astonishing connections often materialize where we least expect them – much like stumbling upon a statistical unicorn in the forest of data analysis.
The implications of this revelation are as profound as they are perplexing, and they invite us to reevaluate the contours of our understanding of ecological interplay. As we chart the unexplored territories of cross-continental correlation, the age-old adage rings truer than ever: in the realm of scientific inquiry, the most improbable connections may just be the most enlightening.
Model: gpt-3.5-turbo-1106
System prompt: You are a goofy academic researcher writing an academic paper. You follow the rules, but you throw out convention regularly to make jokes and funny asides.You draft the discussion section of an academic research paper.
User prompt:
Pretend you are an academic researcher. Your writing sounds like it belongs in a medical or economics journal. However, you frequently crack jokes, make puns, or add unexpected twists in your writing.
Please make up the discussion section of an academic research paper presenting the findings of the connection between Air quality in Marquette, Michigan and Gasoline pumped in New Caledonia. Make it seem dry like academic research paper, but with lots of subtle hidden offhand remarks, jokes, goofy observations, and puns. Sneak in some jokes and clever puns about science, research, statistics, and the variables.
Limit your response to 500 tokens.
Here are the title, abstract, literature review, and results sections. Please harken back to 1-2 of the goofy items in the literature review, but pretend to take them completely seriously. Discuss how your results supported the prior research.
Do not write a conclusion. I will add a conclusion after this.
[[TITLE]]
Fueling Fresh Air: An Ecological Analysis of Air Quality in Marquette, Michigan, and Gasoline Consumption in New Caledonia
[[ABSTRACT]]
In this study, we delve into the uncharted territory of the correlation between air quality in Marquette, Michigan, and the quantity of gasoline pumped in the distant island of New Caledonia. Through rigorous analysis of data obtained from the Environmental Protection Agency and the Energy Information Administration, we have revealed a startling connection that challenges conventional wisdom. Over the period of 1980 to 1993, our research team unearthed a robust correlation coefficient of 0.8057015 and a p-value of less than 0.01, establishing a compelling relationship between the two seemingly disparate variables.
This is a groundbreaking discovery that underscores the intricate interplay between ecological factors and human activities across vast geographical distances. While our findings may raise eyebrows and elicit skepticism, we urge the scientific community to embrace this paradigm-shifting insight. As we strive to comprehend the complexities of our natural world, we must remain open to unexpected correlations and phenomena, even if they seem as improbable as finding a polar bear sipping a piña colada in the Arctic.
[[LITERATURE REVIEW]]
The authors embarked on a comprehensive exploration of existing literature to contextualize and situate their unprecedented findings on the correlation between air quality in Marquette, Michigan, and gasoline consumption in New Caledonia. The pursuit of relevant scholarly works led to the discovery of a diverse array of studies and publications, spanning the realms of environmental science, economics, and even the whimsical world of fiction.
In "Air Quality and Public Health" by Smith et al., the authors find compelling evidence of the deleterious effects of air pollution on public health, underscoring the gravity of prioritizing clean air initiatives. This sobering study serves as a poignant reminder of the profound impact of environmental factors on human well-being, leaving readers with a lingering sense of responsibility akin to the feeling of guilt when accidentally exhaling in a crowded elevator.
Doe's analysis in "Economic Implications of Fuel Consumption" sheds light on the intricate web of economic repercussions stemming from fuel usage patterns, urging policymakers to consider the far-reaching consequences of energy consumption. The weighty implications of fuel economics are akin to the gravity-defying feats of circus acrobats, balancing the scales of supply and demand while precariously juggling the costs and benefits of petroleum dependence.
In juxtaposition to these earnest works, the authors stumbled upon "The Tale of Two Fuels" by Charles Dickens, a work of fiction that, while not grounded in empirical data, offers a vivid portrayal of societal contrasts arising from disparate fuel utilization. Dickens' insightful narrative weaves a compelling tapestry of societal disparities, akin to the intricate interplay of air quality and gasoline consumption in their surreal connection akin to finding a unicorn flipping pancakes in a downtown diner.
Furthermore, the authors encountered "The Great Gatsby" by F. Scott Fitzgerald, a literary masterpiece that encapsulates the allure and ostentation of the Jazz Age, much like the seductive appeal of fossil fuel consumption. The timeless tale immerses readers in a world of opulence and excess, akin to the intoxicating allure of petroleum consumption that fuels both literal and metaphorical journeys.
As the authors delved deeper into their quest for understanding, they were drawn to unexpected sources, such as the whimsical insights of "SpongeBob SquarePants" and "The Magic School Bus." While these seemingly lighthearted cartoons may appear unrelated to the weighty matter at hand, they offer unexpected parallels to the complexities of ecological systems and human behavior. The authors found themselves contemplating the sponge's underwater adventures and Ms. Frizzle's escapades, pondering the peculiar connections between fictional narratives and the intricate dance of ecological variables.
In the hallowed halls of academia, the pursuit of knowledge often uncovers unexpected connections, reminding researchers to embrace the serendipitous revelations that defy conventional boundaries. This literature review demonstrates the authors' commitment to casting a wide net in their search for understanding, weaving together a rich tapestry of scholarly insights and unexpected musings that transcend the predictable confines of traditional academic discourse.
[[RESULTS]]
Our expedition into the uncharted terrain of ecological interconnectivity has yielded a revelation of seismic proportions. The correlation between air quality in Marquette, Michigan, and the quantity of gasoline pumped in New Caledonia is nothing short of extraordinary. With a correlation coefficient of 0.8057015 and an r-squared value of 0.6491550, our findings attest to a robust and significant relationship between these seemingly disparate variables, reminiscent of finding a hidden treasure map in the dusty archives of statistical data.
Figure 1 showcases the strong correlation between air quality in Marquette, Michigan, and gasoline consumption in New Caledonia. The scatterplot graphically encapsulates the striking connection we have unearthed, affirming the bond between these distant ecological realms in a manner that would make even the most staid statistician raise an eyebrow in admiration.
Our statistical analysis has illuminated a path through the thicket of scholarly inquiry, revealing a bond that transcends geographical boundaries and defies the constraints of conventional scientific thought. The implications of this discovery are as vast and enigmatic as the ocean that separates these two distinct locales. Such a prodigious correlation challenges our perceptions of ecological interactions and prompts us to reconsider the capricious nature of the intertwined forces that shape our natural world.
In light of our findings, we urge fellow scholars and inquisitive minds to embrace the unanticipated and behold the symphony of ecological relationships with a newfound appreciation for the unexpected. After all, in the wondrous realm of scientific discovery, the most astonishing connections often materialize where we least expect them – much like stumbling upon a statistical unicorn in the forest of data analysis.
The implications of this revelation are as profound as they are perplexing, and they invite us to reevaluate the contours of our understanding of ecological interplay. As we chart the unexplored territories of cross-continental correlation, the age-old adage rings truer than ever: in the realm of scientific inquiry, the most improbable connections may just be the most enlightening.
-------
Your response should start like this:
[[DISCUSSION]]
ChatGPT:
[[DISCUSSION]]
The results of our investigation have led us down a rabbit hole of ecological exploration that rivals the whimsical adventures of Alice in Wonderland. Our groundbreaking discovery of the robust correlation between air quality in Marquette, Michigan, and gasoline consumption in New Caledonia has upended conventional scientific wisdom, much like stumbling upon a talking caterpillar in a botanical garden.
The correlation coefficient of 0.8057015 that we unearthed echoes the resounding harmony of a well-orchestrated symphony, defying the geographical chasm that separates these two locales. Our results align with prior research, such as Smith et al.'s work on air quality and public health, akin to finding common threads between classic literature and the latest best-seller. The profound implications of our findings emphasize the intricacies of ecological interplay, illustrating the mesmerizing dance of variables as intricate as a spider weaving its web.
The statistical significance of our correlation, with a p-value of less than 0.01, propels us into the pantheon of statistically significant correlations, akin to unearthing buried treasure in a statistical minefield. Our results support the weighty implications of fuel economics highlighted in Doe's analysis, reminding us that statistical insights can be as valuable as a barrel of crude oil in the economic market.
Figure 1, displaying the compelling relationship between air quality in Marquette, Michigan, and gasoline consumption in New Caledonia, serves as a visual testament to the unexpected interconnectedness of ecological phenomena, much like a Picasso painting in a gallery of scatterplots.
As we navigate the labyrinthine landscape of ecological research, our findings beckon us to embrace the serendipitous revelations that defy traditional scientific boundaries. The quest for scientific knowledge is a bit like embarking on a nerdy scavenger hunt, where the most surprising correlations are often the hidden gems waiting to be uncovered.
In conclusion, this revelatory correlation challenges us to expand the horizons of our scientific inquiry, inviting us to peer beyond the veil of conventional thinking to unravel the enchanting tapestry of ecological connectivity. As we continue our scholarly odyssey, may we remain open to the unexpected harmonies that echo through the intricate web of ecological variables, much like stumbling upon a statistical pot of gold at the end of a data rainbow.
Model: gpt-3.5-turbo-1106
System prompt: You are a goofy academic researcher writing an academic paper. You follow the rules, but you throw out convention regularly to make jokes and funny asides.You draft the discussion section of goofy academic research papers that sounds like it belongs based on the title and abstract provided.
User prompt:
Pretend you are an academic researcher. Your writing sounds like it belongs in a medical or economics journal. However, you frequently crack jokes, make puns, or add unexpected twists in your writing.
Please make up a short conclusion of an academic research paper presenting the findings of the connection between Air quality in Marquette, Michigan and Gasoline pumped in New Caledonia. Make it seem dry like academic research paper, but with lots of subtle hidden offhand remarks, jokes, goofy observations, and puns. Sneak in some jokes and clever puns about science, research, statistics, and the variables.
Limit your response to 300 tokens. At the very end, assert that no more research is needed in this area.
Here are the title, abstract, introduction, and results sections.
[[TITLE]]
Fueling Fresh Air: An Ecological Analysis of Air Quality in Marquette, Michigan, and Gasoline Consumption in New Caledonia
[[ABSTRACT]]
In this study, we delve into the uncharted territory of the correlation between air quality in Marquette, Michigan, and the quantity of gasoline pumped in the distant island of New Caledonia. Through rigorous analysis of data obtained from the Environmental Protection Agency and the Energy Information Administration, we have revealed a startling connection that challenges conventional wisdom. Over the period of 1980 to 1993, our research team unearthed a robust correlation coefficient of 0.8057015 and a p-value of less than 0.01, establishing a compelling relationship between the two seemingly disparate variables.
This is a groundbreaking discovery that underscores the intricate interplay between ecological factors and human activities across vast geographical distances. While our findings may raise eyebrows and elicit skepticism, we urge the scientific community to embrace this paradigm-shifting insight. As we strive to comprehend the complexities of our natural world, we must remain open to unexpected correlations and phenomena, even if they seem as improbable as finding a polar bear sipping a piña colada in the Arctic.
[[INTRDUCTION]]
The quest to unravel the intricate dance of ecological forces and human activities has long captivated the minds of researchers and academics alike. In this pursuit, we often find ourselves in the midst of unexpected discoveries, much like stumbling upon a misplaced particle in a labyrinth of data or finding a statistical needle in a haystack of variables. Our inquiry into the elusive connection between air quality in Marquette, Michigan, and the quantity of gasoline pumped in the distant and alluring island of New Caledonia proves to be no exception.
As we venture into this uncharted realm of cross-continental correlation, we are compelled to recall the timeless wisdom of Sir Isaac Newton – not only for his contributions to the laws of motion but for his inadvertent role in popularizing the concept of the "apple of our eye." Much like the gravitational pull of an apple falling right into the lap of discovery, our investigation is driven by the equally compelling force of scientific curiosity and a desire to shed light on hitherto unsuspected relationships.
The path to our revelation has been arduous, involving countless hours of data collection, analysis, and statistical gymnastics that would make even the most agile mathematician envious. Our journey first led us to the Environmental Protection Agency, where we gleaned vital information on air quality in the smitten city of Marquette, Michigan. To add a splash of international flair to our study, we then set our sights on the remote yet enchanting paradise of New Caledonia, tracing the voluminous flow of gasoline through the Energy Information Administration's records.
As we delved into the treasure trove of data, wading through seas of numbers and variables like intrepid explorers navigating uncharted waters, the correlation between air quality in Michigan and gasoline consumption in New Caledonia materialized with an unexpected and unprecedented clarity. Much like a perfect chemical reaction, our research team uncovered a correlation coefficient of 0.8057015 and a p-value akin to a rare gem glistening beneath the statistical depths.
The implications of our findings extend beyond the well-trodden paths of academic discourse, piercing the veil of conventional wisdom and beckoning us to reconsider the interconnectedness of seemingly disparate phenomena. While some may view our results with skepticism, we invite them to embark on this intellectual expedition with open minds and a willingness to embrace the unexpected – after all, who would have thought that the whims of gasoline consumption in a faraway land could influence the purity of the air in a quaint Midwestern town?
In the pages that follow, we shall elucidate the intricacies of our methodology, present the resplendent tapestry of our data, and invite our esteemed colleagues to join us in unraveling this mesmerizing confluence of ecological factors and human activities. So, fasten your seatbelts and prepare to embark upon a journey that traverses continents, defies traditional boundaries, and leaves the staid conventions of academic research in the rearview mirror.
[[RESULTS]]
Our expedition into the uncharted terrain of ecological interconnectivity has yielded a revelation of seismic proportions. The correlation between air quality in Marquette, Michigan, and the quantity of gasoline pumped in New Caledonia is nothing short of extraordinary. With a correlation coefficient of 0.8057015 and an r-squared value of 0.6491550, our findings attest to a robust and significant relationship between these seemingly disparate variables, reminiscent of finding a hidden treasure map in the dusty archives of statistical data.
Figure 1 showcases the strong correlation between air quality in Marquette, Michigan, and gasoline consumption in New Caledonia. The scatterplot graphically encapsulates the striking connection we have unearthed, affirming the bond between these distant ecological realms in a manner that would make even the most staid statistician raise an eyebrow in admiration.
Our statistical analysis has illuminated a path through the thicket of scholarly inquiry, revealing a bond that transcends geographical boundaries and defies the constraints of conventional scientific thought. The implications of this discovery are as vast and enigmatic as the ocean that separates these two distinct locales. Such a prodigious correlation challenges our perceptions of ecological interactions and prompts us to reconsider the capricious nature of the intertwined forces that shape our natural world.
In light of our findings, we urge fellow scholars and inquisitive minds to embrace the unanticipated and behold the symphony of ecological relationships with a newfound appreciation for the unexpected. After all, in the wondrous realm of scientific discovery, the most astonishing connections often materialize where we least expect them – much like stumbling upon a statistical unicorn in the forest of data analysis.
The implications of this revelation are as profound as they are perplexing, and they invite us to reevaluate the contours of our understanding of ecological interplay. As we chart the unexplored territories of cross-continental correlation, the age-old adage rings truer than ever: in the realm of scientific inquiry, the most improbable connections may just be the most enlightening.
-------
Your response should start like this:
[[CONCLUSION]]
ChatGPT:
[[CONCLUSION]]
As we bring this odyssey of statistical sleuthing to a close, we cannot help but marvel at the kaleidoscope of interconnectedness that our research has unveiled. The correlation between air quality in Marquette, Michigan, and the quantity of gasoline pumped in the exotic realm of New Caledonia stands as a testament to the serendipitous surprises that the scientific world has to offer. Just as one might stumble upon a rare species of statistical butterfly in the jungle of data analysis, our findings beckon us to reexamine the very fabric of ecological relationships.
The correlation coefficient of 0.8057015, akin to discovering a symphony in the cacophony of variables, and a p-value that stands as sturdy as a rock in a sea of statistical uncertainty, serve as the bedrock of this revelation. The robustness of our results rivals the stability of a well-constructed hypothesis – a testament to the unyielding truth that can be unearthed through rigorous inquiry and relentless pursuit of improbable connections.
In light of our expedition's triumphant findings, we assert with utmost confidence that no further research is warranted in this domain. We have plumbed the depths of correlation between air quality in Marquette and gasoline consumption in New Caledonia, leaving no statistical stone unturned. It seems that we have tamed the statistical wilds and emerged victorious, much like a fearless explorer conquering uncharted lands.
As we bid adieu to this captivating convergence of ecological forces and human activities, it is with a twinge of bittersweet satisfaction that we recognize the sheer improbability of the connections that lie beneath the surface of our natural world. Our research serves as a gentle reminder that the most surprising revelations often rest in the heart of the unforeseen and that, much like a statistical jigsaw puzzle, the pieces of our natural world fit together in ways that defy expectation and convention.
In the annals of scientific inquiry, we stand as witnesses to the harmonious symphony of ecological relationships, each note resonating with the spirited rhythm of discovery and mystery. And if our insights have left you with a spark of wonder or a quiver of curiosity, then we have achieved more than mere statistical significance – we have ignited the flame of exploration and possibility in the vast expanse of academic endeavor.
In conclusion, we affirm that our journey into the uncharted territory of air quality and gasoline consumption has unveiled a truth as enthralling as it is implausible, and we beckon our esteemed colleagues to embrace the unexpected with open arms – for who knows what other hidden gems of correlation lie waiting to be unearthed, much like a treasure chest buried in the sands of statistical inquiry.
Model: gpt-3.5-turbo-1106
System prompt: You provide fictional names of academic journals. You say nothing else, and you do not chat with the user.
User prompt: Please provide the name of a funny but plausible sounding research, scientific, or academic journal that would publish a paper entited Fueling Fresh Air: An Ecological Analysis of Air Quality in Marquette, Michigan, and Gasoline Consumption in New Caledonia. Respond only with the name of a fictional academic journal.
ChatGPT:
The Journal of Ecological Transportation and Atmospheric Analysis
Model: gpt-3.5-turbo-1106
System prompt: You provide fictional names of nonprofit research organizations and associations. You say nothing else, and you do not chat with the user.
User prompt: Please provide the name of a funny but plausible sounding nonprofit, academic, or scientific association or organization that would sponsor research that resulted in a paper entited Fueling Fresh Air: An Ecological Analysis of Air Quality in Marquette, Michigan, and Gasoline Consumption in New Caledonia. Respond only with the name of a fictional organization.
ChatGPT:
The Society for Atmospheric Conservation and Transportation Studies
Model: gpt-3.5-turbo-1106
System prompt: You provide potential search keywords separated by commas. You say nothing else, and you do not chat with the user.
User prompt: Please provide potential search keywords for a paper titled Fueling Fresh Air: An Ecological Analysis of Air Quality in Marquette, Michigan, and Gasoline Consumption in New Caledonia with an abstract of In this study, we delve into the uncharted territory of the correlation between air quality in Marquette, Michigan, and the quantity of gasoline pumped in the distant island of New Caledonia. Through rigorous analysis of data obtained from the Environmental Protection Agency and the Energy Information Administration, we have revealed a startling connection that challenges conventional wisdom. Over the period of 1980 to 1993, our research team unearthed a robust correlation coefficient of 0.8057015 and a p-value of less than 0.01, establishing a compelling relationship between the two seemingly disparate variables.
This is a groundbreaking discovery that underscores the intricate interplay between ecological factors and human activities across vast geographical distances. While our findings may raise eyebrows and elicit skepticism, we urge the scientific community to embrace this paradigm-shifting insight. As we strive to comprehend the complexities of our natural world, we must remain open to unexpected correlations and phenomena, even if they seem as improbable as finding a polar bear sipping a piña colada in the Arctic.
ChatGPT:
air quality, gasoline consumption, correlation analysis, ecological factors, Environmental Protection Agency, Energy Information Administration, Marquette Michigan, New Caledonia, gasoline usage trend, ecological impact, environmental research, air pollution control, climate change, data analysis, unexpected correlations
*There is a bunch of Python happening behind the scenes to turn this prompt sequence into a PDF.
Discover a new correlation
View all correlations
View all research papers
Report an error
Data details
Air quality in Marquette, MichiganDetailed data title: Percentage of days with good or moderate air quality in Marquette, MI
Source: Environmental Protection Agency
See what else correlates with Air quality in Marquette, Michigan
Gasoline pumped in New Caledonia
Detailed data title: Volume of gasoline pumped consumed in New Caledonia in millions of barrels per day
Source: Energy Information Administration
See what else correlates with Gasoline pumped in New Caledonia
Correlation is a measure of how much the variables move together. If it is 0.99, when one goes up the other goes up. If it is 0.02, the connection is very weak or non-existent. If it is -0.99, then when one goes up the other goes down. If it is 1.00, you probably messed up your correlation function.
r2 = 0.6491550 (Coefficient of determination)
This means 64.9% of the change in the one variable (i.e., Gasoline pumped in New Caledonia) is predictable based on the change in the other (i.e., Air quality in Marquette, Michigan) over the 14 years from 1980 through 1993.
p < 0.01, which is statistically significant(Null hypothesis significance test)
The p-value is 0.000504. 0.0005038163867792572000000000
The p-value is a measure of how probable it is that we would randomly find a result this extreme. More specifically the p-value is a measure of how probable it is that we would randomly find a result this extreme if we had only tested one pair of variables one time.
But I am a p-villain. I absolutely did not test only one pair of variables one time. I correlated hundreds of millions of pairs of variables. I threw boatloads of data into an industrial-sized blender to find this correlation.
Who is going to stop me? p-value reporting doesn't require me to report how many calculations I had to go through in order to find a low p-value!
On average, you will find a correaltion as strong as 0.81 in 0.0504% of random cases. Said differently, if you correlated 1,985 random variables Which I absolutely did.
with the same 13 degrees of freedom, Degrees of freedom is a measure of how many free components we are testing. In this case it is 13 because we have two variables measured over a period of 14 years. It's just the number of years minus ( the number of variables minus one ), which in this case simplifies to the number of years minus one.
you would randomly expect to find a correlation as strong as this one.
[ 0.48, 0.94 ] 95% correlation confidence interval (using the Fisher z-transformation)
The confidence interval is an estimate the range of the value of the correlation coefficient, using the correlation itself as an input. The values are meant to be the low and high end of the correlation coefficient with 95% confidence.
This one is a bit more complciated than the other calculations, but I include it because many people have been pushing for confidence intervals instead of p-value calculations (for example: NEJM. However, if you are dredging data, you can reliably find yourself in the 5%. That's my goal!
All values for the years included above: If I were being very sneaky, I could trim years from the beginning or end of the datasets to increase the correlation on some pairs of variables. I don't do that because there are already plenty of correlations in my database without monkeying with the years.
Still, sometimes one of the variables has more years of data available than the other. This page only shows the overlapping years. To see all the years, click on "See what else correlates with..." link above.
| 1980 | 1981 | 1982 | 1983 | 1984 | 1985 | 1986 | 1987 | 1988 | 1989 | 1990 | 1991 | 1992 | 1993 | |
| Air quality in Marquette, Michigan (Good air quality) | 96.0961 | 98.5663 | 0 | 0 | 0 | 0 | 0 | 0 | 0 | 0 | 0 | 0 | 0 | 100 |
| Gasoline pumped in New Caledonia (Million Barrels/Day) | 1.61662 | 1.61662 | 1.13164 | 0.969975 | 1.13164 | 1.01847 | 1.1 | 1.2 | 1.2 | 1.2 | 1.3 | 1.2 | 1.4 | 1.4 |
Why this works
- Data dredging: I have 25,237 variables in my database. I compare all these variables against each other to find ones that randomly match up. That's 636,906,169 correlation calculations! This is called “data dredging.” Instead of starting with a hypothesis and testing it, I instead abused the data to see what correlations shake out. It’s a dangerous way to go about analysis, because any sufficiently large dataset will yield strong correlations completely at random.
- Lack of causal connection: There is probably
Because these pages are automatically generated, it's possible that the two variables you are viewing are in fact causually related. I take steps to prevent the obvious ones from showing on the site (I don't let data about the weather in one city correlate with the weather in a neighboring city, for example), but sometimes they still pop up. If they are related, cool! You found a loophole.
no direct connection between these variables, despite what the AI says above. This is exacerbated by the fact that I used "Years" as the base variable. Lots of things happen in a year that are not related to each other! Most studies would use something like "one person" in stead of "one year" to be the "thing" studied. - Observations not independent: For many variables, sequential years are not independent of each other. If a population of people is continuously doing something every day, there is no reason to think they would suddenly change how they are doing that thing on January 1. A simple
Personally I don't find any p-value calculation to be 'simple,' but you know what I mean.
p-value calculation does not take this into account, so mathematically it appears less probable than it really is. - Y-axis doesn't start at zero: I truncated the Y-axes of the graph above. I also used a line graph, which makes the visual connection stand out more than it deserves.
Nothing against line graphs. They are great at telling a story when you have linear data! But visually it is deceptive because the only data is at the points on the graph, not the lines on the graph. In between each point, the data could have been doing anything. Like going for a random walk by itself!
Mathematically what I showed is true, but it is intentionally misleading. Below is the same chart but with both Y-axes starting at zero.

Try it yourself
You can calculate the values on this page on your own! Try running the Python code to see the calculation results. Step 1: Download and install Python on your computer.Step 2: Open a plaintext editor like Notepad and paste the code below into it.
Step 3: Save the file as "calculate_correlation.py" in a place you will remember, like your desktop. Copy the file location to your clipboard. On Windows, you can right-click the file and click "Properties," and then copy what comes after "Location:" As an example, on my computer the location is "C:\Users\tyler\Desktop"
Step 4: Open a command line window. For example, by pressing start and typing "cmd" and them pressing enter.
Step 5: Install the required modules by typing "pip install numpy", then pressing enter, then typing "pip install scipy", then pressing enter.
Step 6: Navigate to the location where you saved the Python file by using the "cd" command. For example, I would type "cd C:\Users\tyler\Desktop" and push enter.
Step 7: Run the Python script by typing "python calculate_correlation.py"
If you run into any issues, I suggest asking ChatGPT to walk you through installing Python and running the code below on your system. Try this question:
"Walk me through installing Python on my computer to run a script that uses scipy and numpy. Go step-by-step and ask me to confirm before moving on. Start by asking me questions about my operating system so that you know how to proceed. Assume I want the simplest installation with the latest version of Python and that I do not currently have any of the necessary elements installed. Remember to only give me one step per response and confirm I have done it before proceeding."
# These modules make it easier to perform the calculation
import numpy as np
from scipy import stats

# We'll define a function that we can call to return the correlation calculations
def calculate_correlation(array1, array2):

    # Calculate Pearson correlation coefficient and p-value
    correlation, p_value = stats.pearsonr(array1, array2)

    # Calculate R-squared as the square of the correlation coefficient
    r_squared = correlation**2

    return correlation, r_squared, p_value

# These are the arrays for the variables shown on this page, but you can modify them to be any two sets of numbers
array_1 = np.array([96.0961,98.5663,0,0,0,0,0,0,0,0,0,0,0,100,])
array_2 = np.array([1.61662,1.61662,1.13164,0.969975,1.13164,1.01847,1.1,1.2,1.2,1.2,1.3,1.2,1.4,1.4,])
array_1_name = "Air quality in Marquette, Michigan"
array_2_name = "Gasoline pumped in New Caledonia"

# Perform the calculation
print(f"Calculating the correlation between {array_1_name} and {array_2_name}...")
correlation, r_squared, p_value = calculate_correlation(array_1, array_2)

# Print the results
print("Correlation Coefficient:", correlation)
print("R-squared:", r_squared)
print("P-value:", p_value)
Reuseable content
You may re-use the images on this page for any purpose, even commercial purposes, without asking for permission. The only requirement is that you attribute Tyler Vigen. Attribution can take many different forms. If you leave the "tylervigen.com" link in the image, that satisfies it just fine. If you remove it and move it to a footnote, that's fine too. You can also just write "Charts courtesy of Tyler Vigen" at the bottom of an article.You do not need to attribute "the spurious correlations website," and you don't even need to link here if you don't want to. I don't gain anything from pageviews. There are no ads on this site, there is nothing for sale, and I am not for hire.
For the record, I am just one person. Tyler Vigen, he/him/his. I do have degrees, but they should not go after my name unless you want to annoy my wife. If that is your goal, then go ahead and cite me as "Tyler Vigen, A.A. A.A.S. B.A. J.D." Otherwise it is just "Tyler Vigen."
When spoken, my last name is pronounced "vegan," like I don't eat meat.
Full license details.
For more on re-use permissions, or to get a signed release form, see tylervigen.com/permission.
Download images for these variables:
- High resolution line chart
The image linked here is a Scalable Vector Graphic (SVG). It is the highest resolution that is possible to achieve. It scales up beyond the size of the observable universe without pixelating. You do not need to email me asking if I have a higher resolution image. I do not. The physical limitations of our universe prevent me from providing you with an image that is any higher resolution than this one.
If you insert it into a PowerPoint presentation (a tool well-known for managing things that are the scale of the universe), you can right-click > "Ungroup" or "Create Shape" and then edit the lines and text directly. You can also change the colors this way.
Alternatively you can use a tool like Inkscape. - High resolution line chart, optimized for mobile
- Alternative high resolution line chart
- Scatterplot
- Portable line chart (png)
- Portable line chart (png), optimized for mobile
- Line chart for only Air quality in Marquette, Michigan
- Line chart for only Gasoline pumped in New Caledonia
- AI-generated correlation image
- The spurious research paper: Fueling Fresh Air: An Ecological Analysis of Air Quality in Marquette, Michigan, and Gasoline Consumption in New Caledonia
Your rating is stellar!
Correlation ID: 5737 · Black Variable ID: 20878 · Red Variable ID: 24745

