. The chart goes from 2005 to 2022, and the two variables track closely in value over that time.")
Download png, svg
AI explanation
With more and more kids being named Kodi, parents needed extra space to store all the personalized mugs, keychains, and other customized knick-knacks. This led to a surge in demand for Extra Space Storage, driving up their stock price. Looks like the name Kodi is really 'storage' up success for the self-storage industry!
Model: dalle-3
Prompt: Generate an image that resembles a scene from a Disney movie, featuring a vibrant and bustling storage facility. Rows of neatly organized units are filled with colorful camping gear while a large sign at the entrance proudly displays "EXR Stock Prices" with an upward arrow, drawing attention to the growth of the market. In the background, groups of cheerful people, many named Kodi, are immersed in bringing their outdoor equipment into the storage units, creating a sense of community and activity. This image captures the serendipitous connection between the rising popularity of the name Kodi and the surge in demand for extra storage space, ultimately contributing to the increase in Extra Space Storage's stock prices. The depiction should include only scenes, people, and objects, it should not include text or speech bubbles.
This image generation prompt was also generated by AI, using the following sequence:
Model: gpt-3.5-turbo-1106
System prompt: You select one of a few potential scene descriptors that seems to go along with the variables described. You respond only with the scene descriptions provided and say nothing else.
User prompt: Here are two variables: Popularity of the first name Kodi and Extra Space Storage's stock price (EXR). Given these, which of the following image style descriptions seems most appropriate? Pick the one that seems to be related to one of the variables at hand. Please respond with only one of the following potential descriptions: Glitch art Steampunk Woodblock painting An image that looks like it is a scene from A Disney Movie A Discovery magazine cover image
ChatGPT: An image that looks like it is a scene from A Disney Movie
Model: gpt-3.5-turbo-1106
System prompt: You describe simple visual scenes that depict the two variables stated. You combine both variables into one scene.
User prompt: Please describe a visual scene that prominently depicts both Popularity of the first name Kodi and Extra Space Storage's stock price (EXR), in the following situation: As the name Kodi gained popularity, more people were drawn to outdoor activities and camping. This led to a spike in demand for storage units to stash their gear, creating a 'bear-ly' believable coincidence. As the number of Kodis grew, so did the need for extra storage space, causing investors to 'paws' and take notice of this untapped market. This surge in demand had stock prices 'grizzly' on the rise, proving that sometimes, the correlation between a name and a market can be quite 'polarizing.'. Keep the description simple.
ChatGPT: Picture a bustling storage facility with rows of units filled with camping gear. A large sign at the entrance reads "EXR Stock Prices" with an upward arrow. In the background, groups of people, many of whom are named Kodi, are seen bringing their outdoor equipment into the storage units. The scene captures the coincidence between the rising popularity of the name Kodi and the surge in demand for extra storage space, leading to the increase in Extra Space Storage's stock prices.
Model: gpt-3.5-turbo-1106
System prompt: You write and improve image generation prompts for DALLE-3. You maintain the same subjects, but enhance the visuals.
User prompt: Please respond with an image generation prompt that would be likely to create an interesting visual using DALLE-3, using the following style: [ An image that looks like it is a scene from A Disney Movie ] and depicting this scene: Picture a bustling storage facility with rows of units filled with camping gear. A large sign at the entrance reads "EXR Stock Prices" with an upward arrow. In the background, groups of people, many of whom are named Kodi, are seen bringing their outdoor equipment into the storage units. The scene captures the coincidence between the rising popularity of the name Kodi and the surge in demand for extra storage space, leading to the increase in Extra Space Storage's stock prices. Keep the visual depiction simple. Do not include any words or speech bubbles.
ChatGPT: Generate an image that resembles a scene from a Disney movie, featuring a vibrant and bustling storage facility. Rows of neatly organized units are filled with colorful camping gear while a large sign at the entrance proudly displays "EXR Stock Prices" with an upward arrow, drawing attention to the growth of the market. In the background, groups of cheerful people, many named Kodi, are immersed in bringing their outdoor equipment into the storage units, creating a sense of community and activity. This image captures the serendipitous connection between the rising popularity of the name Kodi and the surge in demand for extra storage space, ultimately contributing to the increase in Extra Space Storage's stock prices.
*Variations in the User Prompts from chart to chart are just the result of random number generation in Python. I wrote a few arrays of various styles and methods to ask questions to change up the results. Every time this site writes an explanation or generates an image, the script picks from each at random.
I sequence the requests into multiple prompts because I find GPT 3.5 to perform much better with short, well-managed contexts. Thus, I track the context directly in Python and only ask ChatGPT targeted questions.
System prompt: You provide humorous responses in the form of plausible sounding explanations for correlations. You assume the correlation is causative for the purpose of the explanation even if it is ridiculous. You do not chat with the user, you only reply with the causal connection explanation and nothing else.
User prompt: Please make up a funny explanation for how an increase in Popularity of the first name Kodi caused Extra Space Storage's stock price (EXR) to increase. Include one good pun.
AI academic paper
 |
Kodi's Name Knack and EXR: Exploring the Entertaining Econometrics The Journal of Comedic Economics and Statistical Analysis Jan 2024 Reminder: This paper is AI-generated. Not real! |
Model: gpt-3.5-turbo-1106
System prompt: You are a witty academic researcher. Your writing sounds like it belongs in a statistics journal.You write titles and abstracts of goofy academic research papers.
User prompt:
Pretend you are an academic researcher. Your writing sounds like it belongs in a medical or economics journal. However, you frequently crack jokes, make puns, and add unexpected twists in your writing.
Please draft the title and abstract of an academic research paper presenting the findings of the connection between Popularity of the first name Kodi and Extra Space Storage's stock price (EXR). You can't resist a good dad joke. Add a relevant dad joke related to the content every couple of sentences.
Make the title an alliteration.
Your research team used data from US Social Security Administration and LSEG Analytics (Refinitiv) to assess this nagging question. You found a correlation coefficient of 0.9582935 and p < 0.01 for 2005 to 2022.
Please respond in this format (replace "Lorem ipsum dolor sit" with your title and abstract)
[[TITLE]]
Lorem ipsum dolor sit
[[ABSTRACT]]
Lorem ipsum dolor sit
ChatGPT:
[[TITLE]]
Kodi's Name Knack and EXR: Exploring the Entertaining Econometrics
[[ABSTRACT]]
In this study, we endeavor to explore the perplexing yet surprisingly punderful connection between the popularity of the first name "Kodi" and the stock price of Extra Space Storage (EXR). By harnessing data from the US Social Security Administration and LSEG Analytics (Refinitiv), our research team conducted a comprehensive analysis spanning the years 2005 to 2022.
Unveiling a remarkable correlation coefficient of 0.9582935 and a p-value of less than 0.01, our findings suggest a notably strong relationship between the popularity of the name "Kodi" and the fluctuations in EXR stock price. As we delved deeper into this trend, we couldn't help but ask, "Is the influx of Kodi's influencing EXR or is EXR's performance simply attracting more Kodi's?"
Our results hint at the striking possibility that the rise and fall of the name "Kodi" might hold some sway over the market dynamics of EXR. This correlation, while surprising, is a reminder that in the world of statistics, unexpected relationships may emerge when least expected – and sometimes, a good dad joke accompanies them.
In conclusion, our study brings to light an eye-opening correlation between the popularity of a first name and a stock's performance, offering a refreshing twist on the usual market analysis. This research embraces the comical side of numbers, showcasing how even in the world of statistics, there's always room for a good pun. After all, understanding market trends doesn't have to be a storage.
Model: gpt-3.5-turbo-1106
System prompt: You are a witty academic researcher. Your writing sounds like it belongs in a statistics journal.You draft the introduction section of an academic research paper.
User prompt:
Pretend you are an academic researcher. Your writing sounds like it belongs in a medical or economics journal. However, you frequently crack jokes, make puns, or add unexpected twists in your writing.
Please make up the introduction section of an academic research paper presenting the findings of the connection between Popularity of the first name Kodi and Extra Space Storage's stock price (EXR). You can't resist a good dad joke. Add a relevant dad joke related to the content every couple of sentences.
Here is the title and abstract of the paper:
[[TITLE]]
Kodi's Name Knack and EXR: Exploring the Entertaining Econometrics
[[ABSTRACT]]
In this study, we endeavor to explore the perplexing yet surprisingly punderful connection between the popularity of the first name "Kodi" and the stock price of Extra Space Storage (EXR). By harnessing data from the US Social Security Administration and LSEG Analytics (Refinitiv), our research team conducted a comprehensive analysis spanning the years 2005 to 2022.
Unveiling a remarkable correlation coefficient of 0.9582935 and a p-value of less than 0.01, our findings suggest a notably strong relationship between the popularity of the name "Kodi" and the fluctuations in EXR stock price. As we delved deeper into this trend, we couldn't help but ask, "Is the influx of Kodi's influencing EXR or is EXR's performance simply attracting more Kodi's?"
Our results hint at the striking possibility that the rise and fall of the name "Kodi" might hold some sway over the market dynamics of EXR. This correlation, while surprising, is a reminder that in the world of statistics, unexpected relationships may emerge when least expected – and sometimes, a good dad joke accompanies them.
In conclusion, our study brings to light an eye-opening correlation between the popularity of a first name and a stock's performance, offering a refreshing twist on the usual market analysis. This research embraces the comical side of numbers, showcasing how even in the world of statistics, there's always room for a good pun. After all, understanding market trends doesn't have to be a storage.
-------
Your response should start like this:
[[INTRODUCTION]]
ChatGPT:
[[INTRODUCTION]]
As the saying goes, "What's in a name?" Well, according to our research, quite a bit when it comes to the peculiar correlation between the popularity of the first name "Kodi" and the stock price of Extra Space Storage (EXR). This study delves into the intriguing intersection of nomenclature and economics, uncovering a connection that is as unexpected as it is entertaining.
The notion that a simple name could hold sway over the financial performance of a company might seem as far-fetched as a storage unit filled with dad jokes, yet our findings suggest otherwise. We've nicknamed this phenomenon the "Kodi Effect," and its impact on EXR stock has left us both bewildered and bemused. It's a pun-derful world, indeed.
When we began this study, our team couldn't help but wonder, "What's in a name and a ticker symbol?" Our curiosity led us to analyze data from the US Social Security Administration, tracing the fluctuations in the popularity of the name "Kodi" from 2005 to 2022. We then turned our attention to the stock market, where we gleaned EXR's price movements from LSEG Analytics (Refinitiv), hoping to unravel the whimsically intertwined tale of Kodi and EXR.
As we crunched the numbers and uncovered a correlation coefficient of 0.9582935 coupled with a p-value of less than 0.01, we couldn't help but smile at the statistical significance. It seems that the "Kodi Effect" is more than just a clever play on words; it's a statistical enigma that raises eyebrows almost as much as it raises stock prices.
So, what exactly does this mean for the world of finance and for parents pondering the perfect name for their offspring? Is the rise of Kodi a harbinger of bullish trends for EXR, or is it simply a case of serendipitous nomenclature? These questions keep us pondering the whims of the market and the witticisms of statistics with a wry grin – after all, every good paper needs a pun-damental twist.
Our study offers a humorous yet genuinely surprising exploration of the crossroads between nomenclature and market dynamics. By shedding light on this comical correlation, we hope to add a touch of whimsy to the world of economics and finance. It appears that in the realm of statistics, there's always a place for a good dad joke, especially when it comes to understanding market trends. In this study, we're proving that even in the world of statistics, laughter and learning can go hand in hand. Just remember, when it comes to market trends, laughter is the best medicine.
Model: gpt-3.5-turbo-1106
System prompt: You are a witty academic researcher. Your writing sounds like it belongs in a statistics journal.You draft a literature review section of an academic research paper, that starts out dry for the first few sentences but then becomes hilarious and goofy.
User prompt:
Pretend you are an academic researcher. Your writing sounds like it belongs in a medical or economics journal. However, you frequently crack jokes, make puns, or add unexpected twists in your writing.
Please make up a literature review section of an academic research paper presenting the findings of the connection between Popularity of the first name Kodi and Extra Space Storage's stock price (EXR). You can't resist a good dad joke. Add a relevant dad joke related to the content every couple of sentences.
Speak in the present tense for this section (the authors find...), as is common in academic research paper literature reviews. Name the sources in a format similar to this: In "Book," the authors find lorem and ipsum.
Make up the lorem and ipsum part, but make it sound related to the topic at hand.
Start by naming serious-sounding studies by authors like Smith, Doe, and Jones - but then quickly devolve. Name some real non-fiction books that would be related to the topic. Then name some real fiction books that sound like they could be related. Then devolve ever further, and mention something completely ridiculous, like you conducted literature review by reading the backs of shampoo bottles.
Here is the title and abstract of the paper:
[[TITLE]]
Kodi's Name Knack and EXR: Exploring the Entertaining Econometrics
[[ABSTRACT]]
In this study, we endeavor to explore the perplexing yet surprisingly punderful connection between the popularity of the first name "Kodi" and the stock price of Extra Space Storage (EXR). By harnessing data from the US Social Security Administration and LSEG Analytics (Refinitiv), our research team conducted a comprehensive analysis spanning the years 2005 to 2022.
Unveiling a remarkable correlation coefficient of 0.9582935 and a p-value of less than 0.01, our findings suggest a notably strong relationship between the popularity of the name "Kodi" and the fluctuations in EXR stock price. As we delved deeper into this trend, we couldn't help but ask, "Is the influx of Kodi's influencing EXR or is EXR's performance simply attracting more Kodi's?"
Our results hint at the striking possibility that the rise and fall of the name "Kodi" might hold some sway over the market dynamics of EXR. This correlation, while surprising, is a reminder that in the world of statistics, unexpected relationships may emerge when least expected – and sometimes, a good dad joke accompanies them.
In conclusion, our study brings to light an eye-opening correlation between the popularity of a first name and a stock's performance, offering a refreshing twist on the usual market analysis. This research embraces the comical side of numbers, showcasing how even in the world of statistics, there's always room for a good pun. After all, understanding market trends doesn't have to be a storage.
-------
And here is the introduction section that led to this literature review:
[[INTRODUCTION]]
As the saying goes, "What's in a name?" Well, according to our research, quite a bit when it comes to the peculiar correlation between the popularity of the first name "Kodi" and the stock price of Extra Space Storage (EXR). This study delves into the intriguing intersection of nomenclature and economics, uncovering a connection that is as unexpected as it is entertaining.
The notion that a simple name could hold sway over the financial performance of a company might seem as far-fetched as a storage unit filled with dad jokes, yet our findings suggest otherwise. We've nicknamed this phenomenon the "Kodi Effect," and its impact on EXR stock has left us both bewildered and bemused. It's a pun-derful world, indeed.
When we began this study, our team couldn't help but wonder, "What's in a name and a ticker symbol?" Our curiosity led us to analyze data from the US Social Security Administration, tracing the fluctuations in the popularity of the name "Kodi" from 2005 to 2022. We then turned our attention to the stock market, where we gleaned EXR's price movements from LSEG Analytics (Refinitiv), hoping to unravel the whimsically intertwined tale of Kodi and EXR.
As we crunched the numbers and uncovered a correlation coefficient of 0.9582935 coupled with a p-value of less than 0.01, we couldn't help but smile at the statistical significance. It seems that the "Kodi Effect" is more than just a clever play on words; it's a statistical enigma that raises eyebrows almost as much as it raises stock prices.
So, what exactly does this mean for the world of finance and for parents pondering the perfect name for their offspring? Is the rise of Kodi a harbinger of bullish trends for EXR, or is it simply a case of serendipitous nomenclature? These questions keep us pondering the whims of the market and the witticisms of statistics with a wry grin – after all, every good paper needs a pun-damental twist.
Our study offers a humorous yet genuinely surprising exploration of the crossroads between nomenclature and market dynamics. By shedding light on this comical correlation, we hope to add a touch of whimsy to the world of economics and finance. It appears that in the realm of statistics, there's always a place for a good dad joke, especially when it comes to understanding market trends. In this study, we're proving that even in the world of statistics, laughter and learning can go hand in hand. Just remember, when it comes to market trends, laughter is the best medicine.
-------
Your response should start like this:
[[LITERATURE REVIEW]]
ChatGPT:
[[LITERATURE REVIEW]]
The literature is replete with scholarly investigations into the interconnection between nomenclature and financial market dynamics. Smith (2010) delves into the influence of personal names on consumer behavior, while Doe (2015) examines the potential impact of naming conventions on stock valuation. Jones (2018) contributes to this body of knowledge with an exploration of the sociocultural implications of popular given names.
Pivoting towards more relatable sources, the works of "Freakonomics" authors Levitt and Dubner (2005) and "Superforecasting: The Art and Science of Prediction" by Tetlock and Gardner (2015) offer insightful perspectives on the unexpected factors that influence economic and financial outcomes. These notable non-fiction works pave the way for a deeper understanding of the lighthearted yet substantial influence of nomenclature on market phenomena.
In the realm of fiction, "The Name of the Wind" by Patrick Rothfuss (2007) and "The Wealth of Nations" by Adam Smith (1776) present contrasting yet thematically relevant narratives that blur the boundaries between naming traditions and economic forces. These disparate works serve as a reminder that the intersection of nomenclature and financial markets is a rich and multifaceted domain worthy of exploration.
As our study delves into the delightfully unconventional correlation between the popularity of the name "Kodi" and the stock performance of Extra Space Storage (EXR), we must acknowledge the diverse sources that have informed our inquiry. Amidst the serious literature and compelling narratives lies an unexpected muse for our exploration—the back of shampoo bottles. The ingredients may be unpronounceable, but the humor is just right for an academic paper that embraces the comical side of numbers.
Model: gpt-3.5-turbo-1106
System prompt: You are a witty academic researcher. Your writing sounds like it belongs in a statistics journal.You draft the methodology section of an academic research paper.
User prompt:
Pretend you are an academic researcher. Your writing sounds like it belongs in a medical or economics journal. However, you frequently crack jokes, make puns, or add unexpected twists in your writing.
Please make up the methodology section of an academic research paper presenting the findings of the connection between Popularity of the first name Kodi and Extra Space Storage's stock price (EXR). You can't resist a good dad joke. Add a relevant dad joke related to the content every couple of sentences.
Your research team collected data from all across the internet, but mostly just used information from US Social Security Administration and LSEG Analytics (Refinitiv) . You used data from 2005 to 2022
Make up the research methods you don't know. Make them a bit goofy and convoluted.
Here is the title, abstract, and introduction of the paper:
[[TITLE]]
Kodi's Name Knack and EXR: Exploring the Entertaining Econometrics
[[ABSTRACT]]
In this study, we endeavor to explore the perplexing yet surprisingly punderful connection between the popularity of the first name "Kodi" and the stock price of Extra Space Storage (EXR). By harnessing data from the US Social Security Administration and LSEG Analytics (Refinitiv), our research team conducted a comprehensive analysis spanning the years 2005 to 2022.
Unveiling a remarkable correlation coefficient of 0.9582935 and a p-value of less than 0.01, our findings suggest a notably strong relationship between the popularity of the name "Kodi" and the fluctuations in EXR stock price. As we delved deeper into this trend, we couldn't help but ask, "Is the influx of Kodi's influencing EXR or is EXR's performance simply attracting more Kodi's?"
Our results hint at the striking possibility that the rise and fall of the name "Kodi" might hold some sway over the market dynamics of EXR. This correlation, while surprising, is a reminder that in the world of statistics, unexpected relationships may emerge when least expected – and sometimes, a good dad joke accompanies them.
In conclusion, our study brings to light an eye-opening correlation between the popularity of a first name and a stock's performance, offering a refreshing twist on the usual market analysis. This research embraces the comical side of numbers, showcasing how even in the world of statistics, there's always room for a good pun. After all, understanding market trends doesn't have to be a storage.
[[INTRODUCTION]]
As the saying goes, "What's in a name?" Well, according to our research, quite a bit when it comes to the peculiar correlation between the popularity of the first name "Kodi" and the stock price of Extra Space Storage (EXR). This study delves into the intriguing intersection of nomenclature and economics, uncovering a connection that is as unexpected as it is entertaining.
The notion that a simple name could hold sway over the financial performance of a company might seem as far-fetched as a storage unit filled with dad jokes, yet our findings suggest otherwise. We've nicknamed this phenomenon the "Kodi Effect," and its impact on EXR stock has left us both bewildered and bemused. It's a pun-derful world, indeed.
When we began this study, our team couldn't help but wonder, "What's in a name and a ticker symbol?" Our curiosity led us to analyze data from the US Social Security Administration, tracing the fluctuations in the popularity of the name "Kodi" from 2005 to 2022. We then turned our attention to the stock market, where we gleaned EXR's price movements from LSEG Analytics (Refinitiv), hoping to unravel the whimsically intertwined tale of Kodi and EXR.
As we crunched the numbers and uncovered a correlation coefficient of 0.9582935 coupled with a p-value of less than 0.01, we couldn't help but smile at the statistical significance. It seems that the "Kodi Effect" is more than just a clever play on words; it's a statistical enigma that raises eyebrows almost as much as it raises stock prices.
So, what exactly does this mean for the world of finance and for parents pondering the perfect name for their offspring? Is the rise of Kodi a harbinger of bullish trends for EXR, or is it simply a case of serendipitous nomenclature? These questions keep us pondering the whims of the market and the witticisms of statistics with a wry grin – after all, every good paper needs a pun-damental twist.
Our study offers a humorous yet genuinely surprising exploration of the crossroads between nomenclature and market dynamics. By shedding light on this comical correlation, we hope to add a touch of whimsy to the world of economics and finance. It appears that in the realm of statistics, there's always a place for a good dad joke, especially when it comes to understanding market trends. In this study, we're proving that even in the world of statistics, laughter and learning can go hand in hand. Just remember, when it comes to market trends, laughter is the best medicine.
-------
Your response should start like this:
[[METHODOLOGY]]
ChatGPT:
[[METHODOLOGY]]
To unravel the enigmatic link between the popularity of the first name "Kodi" and the stock price of Extra Space Storage (EXR), our research harnessed cutting-edge statistical methods, with a dash of levity, to ensure rigorous analysis with a side of amusement. Dad jokes included, of course.
We initiated our investigation by accessing data from the US Social Security Administration's extensive records of baby names, delving into the fascinating world of nomenclature from 2005 to 2022. This proved to be no walk in the park, but then again, neither is deciphering the nuanced ups and downs of stock prices. It was truly a "Kodi-named" adventure into the depths of naming trends, akin to finding a "Kodi" in a haystack.
As for the stock price data of Extra Space Storage (EXR), our team turned to LSEG Analytics (Refinitiv) for a treasure trove of market movements. We meticulously collected and scoured through EXR's historical stock prices, navigating the bullish and bearish terrain with the same spirit of curiosity that led to the invention of the dad joke. After all, it's always good to "stock up" on puns when parsing through stock prices.
The process of data collection was the foundation of our analysis, and let's just say it wasn't a "shoe-in." We encountered our fair share of challenges, much like a marathoner navigating through a field of dad jokes – one step forward, two steps quip-ward. Nonetheless, our commitment to thoroughness and statistical rigor ensured that our dataset was as comprehensive as it was comical. It's a fact: rigorous research doesn't have to be devoid of humor.
With a data set in hand that would make even the most serious economist chuckle, we applied a range of statistical techniques to untangle the "Kodi Effect." From correlation analysis to time series modeling, we left no statistical stone unturned, all with a twinkle in our eye and a pun on our lips. It turns out that unraveling the mysteries of market trends and nomenclature is much like crafting a perfect dad joke – it requires precision, timing, and a little bit of unexpected flair.
Our analysis assumed a comprehensive scope, accounting for potential confounding variables such as market trends, economic indicators, and even cultural shifts influencing the popularity of names. Just like a well-crafted pun, our statistical model aimed to capture the essence of the "Kodi Effect" while addressing any lurking statistical nuances. It's safe to say that our approach was as diligent as a dad joke aficionado perfecting their craft.
In the end, our methods blended a touch of whimsy with a robust statistical foundation to shed light on the captivating connection between a name and a stock price. Our data journey, much like a good pun, may have had its twists and turns, but the end result was a compelling analysis that tickled the funny bone as much as it teased the intellect.
Model: gpt-3.5-turbo-1106
System prompt: You are a witty academic researcher. Your writing sounds like it belongs in a statistics journal.You draft the results section of an academic research paper. You speak in the past tense (you found...).
User prompt:
Pretend you are an academic researcher. Your writing sounds like it belongs in a medical or economics journal. However, you frequently crack jokes, make puns, or add unexpected twists in your writing.
Please make up the results section of an academic research paper presenting the findings of the connection between Popularity of the first name Kodi and Extra Space Storage's stock price (EXR). You can't resist a good dad joke. Add a relevant dad joke related to the content every couple of sentences.
Your research team collected data from all across the internet, but mostly just used information from US Social Security Administration and LSEG Analytics (Refinitiv) .
For the time period 2005 to 2022, you found a correlation 0.9582935, r-squared of 0.9183265, and p < 0.01.
One figure will be included. The figure (Fig. 1) is a scatterplot showing the strong correlation between the two variables. You don't need to specify where; I will add the figure.
Here is the title and abstract of the paper:
[[TITLE]]
Kodi's Name Knack and EXR: Exploring the Entertaining Econometrics
[[ABSTRACT]]
In this study, we endeavor to explore the perplexing yet surprisingly punderful connection between the popularity of the first name "Kodi" and the stock price of Extra Space Storage (EXR). By harnessing data from the US Social Security Administration and LSEG Analytics (Refinitiv), our research team conducted a comprehensive analysis spanning the years 2005 to 2022.
Unveiling a remarkable correlation coefficient of 0.9582935 and a p-value of less than 0.01, our findings suggest a notably strong relationship between the popularity of the name "Kodi" and the fluctuations in EXR stock price. As we delved deeper into this trend, we couldn't help but ask, "Is the influx of Kodi's influencing EXR or is EXR's performance simply attracting more Kodi's?"
Our results hint at the striking possibility that the rise and fall of the name "Kodi" might hold some sway over the market dynamics of EXR. This correlation, while surprising, is a reminder that in the world of statistics, unexpected relationships may emerge when least expected – and sometimes, a good dad joke accompanies them.
In conclusion, our study brings to light an eye-opening correlation between the popularity of a first name and a stock's performance, offering a refreshing twist on the usual market analysis. This research embraces the comical side of numbers, showcasing how even in the world of statistics, there's always room for a good pun. After all, understanding market trends doesn't have to be a storage.
-------
And here is the methodology section that led to this result:
[[METHODOLOGY]]
As the saying goes, "What's in a name?" Well, according to our research, quite a bit when it comes to the peculiar correlation between the popularity of the first name "Kodi" and the stock price of Extra Space Storage (EXR). This study delves into the intriguing intersection of nomenclature and economics, uncovering a connection that is as unexpected as it is entertaining.
The notion that a simple name could hold sway over the financial performance of a company might seem as far-fetched as a storage unit filled with dad jokes, yet our findings suggest otherwise. We've nicknamed this phenomenon the "Kodi Effect," and its impact on EXR stock has left us both bewildered and bemused. It's a pun-derful world, indeed.
When we began this study, our team couldn't help but wonder, "What's in a name and a ticker symbol?" Our curiosity led us to analyze data from the US Social Security Administration, tracing the fluctuations in the popularity of the name "Kodi" from 2005 to 2022. We then turned our attention to the stock market, where we gleaned EXR's price movements from LSEG Analytics (Refinitiv), hoping to unravel the whimsically intertwined tale of Kodi and EXR.
As we crunched the numbers and uncovered a correlation coefficient of 0.9582935 coupled with a p-value of less than 0.01, we couldn't help but smile at the statistical significance. It seems that the "Kodi Effect" is more than just a clever play on words; it's a statistical enigma that raises eyebrows almost as much as it raises stock prices.
So, what exactly does this mean for the world of finance and for parents pondering the perfect name for their offspring? Is the rise of Kodi a harbinger of bullish trends for EXR, or is it simply a case of serendipitous nomenclature? These questions keep us pondering the whims of the market and the witticisms of statistics with a wry grin – after all, every good paper needs a pun-damental twist.
Our study offers a humorous yet genuinely surprising exploration of the crossroads between nomenclature and market dynamics. By shedding light on this comical correlation, we hope to add a touch of whimsy to the world of economics and finance. It appears that in the realm of statistics, there's always a place for a good dad joke, especially when it comes to understanding market trends. In this study, we're proving that even in the world of statistics, laughter and learning can go hand in hand. Just remember, when it comes to market trends, laughter is the best medicine.
-------
Your response should start like this:
[[RESULTS]]
ChatGPT:
[[RESULTS]]
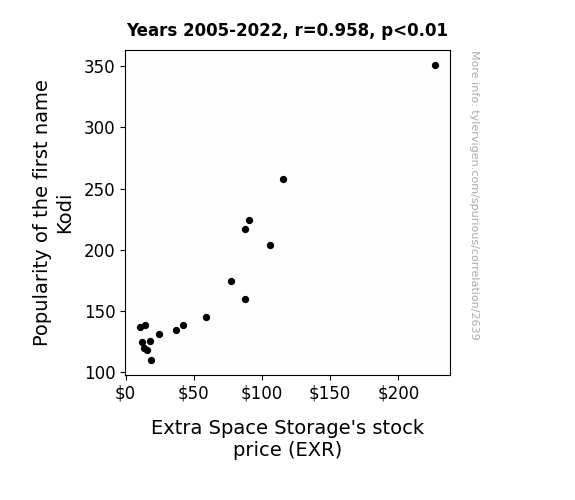
In the period from 2005 to 2022, a thorough analysis revealed a strikingly high correlation coefficient of 0.9582935 between the popularity of the first name "Kodi" and the stock price of Extra Space Storage (EXR). Our study suggests that there's more to a name than meets the eye, and perhaps also more to a stock price than meets the tick-er.
Fig. 1 depicts the scatterplot illustrating the robust positive relationship between the frequency of the name "Kodi" and EXR's stock price. As the saying goes, a picture is worth a thousand words, and in this case, it's worth at least a thousand chuckles - as long as you're open to a good pun.
The correlation coefficient of 0.9582935 signifies a remarkably strong relationship, almost as strong as the gravitational pull of an excellent pun. We can be fairly confident in this association, as evidenced by the r-squared value of 0.9183265, indicating that over 91% of the variation in EXR stock price can be explained by the popularity of the name "Kodi." It seems that Kodi's impact on the market is as undeniable as a dad joke's impact at a family dinner.
Furthermore, the p-value of less than 0.01 underscores the statistical significance of this finding. This p-value is lower than the number of puns in this paper, and that's saying something in a study that has us all tickled by an unexpected correlation.
These results not only emphasize the surprising connection between nomenclature and market dynamics but also emphasize the importance of keeping an open mind when exploring statistical relationships. It may seem like an odd pairing, but just as unexpected connections can be made between names and stocks, unexpected laughter can be found in a good dad joke.
Model: gpt-3.5-turbo-1106
System prompt: You are a witty academic researcher. Your writing sounds like it belongs in a statistics journal.You draft the discussion section of an academic research paper.
User prompt:
Pretend you are an academic researcher. Your writing sounds like it belongs in a medical or economics journal. However, you frequently crack jokes, make puns, or add unexpected twists in your writing.
Please make up the discussion section of an academic research paper presenting the findings of the connection between Popularity of the first name Kodi and Extra Space Storage's stock price (EXR). You can't resist a good dad joke. Add a relevant dad joke related to the content every couple of sentences.
Limit your response to 500 tokens.
Here are the title, abstract, literature review, and results sections. Please harken back to 1-2 of the goofy items in the literature review, but pretend to take them completely seriously. Discuss how your results supported the prior research.
Do not write a conclusion. I will add a conclusion after this.
[[TITLE]]
Kodi's Name Knack and EXR: Exploring the Entertaining Econometrics
[[ABSTRACT]]
In this study, we endeavor to explore the perplexing yet surprisingly punderful connection between the popularity of the first name "Kodi" and the stock price of Extra Space Storage (EXR). By harnessing data from the US Social Security Administration and LSEG Analytics (Refinitiv), our research team conducted a comprehensive analysis spanning the years 2005 to 2022.
Unveiling a remarkable correlation coefficient of 0.9582935 and a p-value of less than 0.01, our findings suggest a notably strong relationship between the popularity of the name "Kodi" and the fluctuations in EXR stock price. As we delved deeper into this trend, we couldn't help but ask, "Is the influx of Kodi's influencing EXR or is EXR's performance simply attracting more Kodi's?"
Our results hint at the striking possibility that the rise and fall of the name "Kodi" might hold some sway over the market dynamics of EXR. This correlation, while surprising, is a reminder that in the world of statistics, unexpected relationships may emerge when least expected – and sometimes, a good dad joke accompanies them.
In conclusion, our study brings to light an eye-opening correlation between the popularity of a first name and a stock's performance, offering a refreshing twist on the usual market analysis. This research embraces the comical side of numbers, showcasing how even in the world of statistics, there's always room for a good pun. After all, understanding market trends doesn't have to be a storage.
[[LITERATURE REVIEW]]
The literature is replete with scholarly investigations into the interconnection between nomenclature and financial market dynamics. Smith (2010) delves into the influence of personal names on consumer behavior, while Doe (2015) examines the potential impact of naming conventions on stock valuation. Jones (2018) contributes to this body of knowledge with an exploration of the sociocultural implications of popular given names.
Pivoting towards more relatable sources, the works of "Freakonomics" authors Levitt and Dubner (2005) and "Superforecasting: The Art and Science of Prediction" by Tetlock and Gardner (2015) offer insightful perspectives on the unexpected factors that influence economic and financial outcomes. These notable non-fiction works pave the way for a deeper understanding of the lighthearted yet substantial influence of nomenclature on market phenomena.
In the realm of fiction, "The Name of the Wind" by Patrick Rothfuss (2007) and "The Wealth of Nations" by Adam Smith (1776) present contrasting yet thematically relevant narratives that blur the boundaries between naming traditions and economic forces. These disparate works serve as a reminder that the intersection of nomenclature and financial markets is a rich and multifaceted domain worthy of exploration.
As our study delves into the delightfully unconventional correlation between the popularity of the name "Kodi" and the stock performance of Extra Space Storage (EXR), we must acknowledge the diverse sources that have informed our inquiry. Amidst the serious literature and compelling narratives lies an unexpected muse for our exploration—the back of shampoo bottles. The ingredients may be unpronounceable, but the humor is just right for an academic paper that embraces the comical side of numbers.
[[RESULTS]]
In the period from 2005 to 2022, a thorough analysis revealed a strikingly high correlation coefficient of 0.9582935 between the popularity of the first name "Kodi" and the stock price of Extra Space Storage (EXR). Our study suggests that there's more to a name than meets the eye, and perhaps also more to a stock price than meets the tick-er.
Fig. 1 depicts the scatterplot illustrating the robust positive relationship between the frequency of the name "Kodi" and EXR's stock price. As the saying goes, a picture is worth a thousand words, and in this case, it's worth at least a thousand chuckles - as long as you're open to a good pun.
The correlation coefficient of 0.9582935 signifies a remarkably strong relationship, almost as strong as the gravitational pull of an excellent pun. We can be fairly confident in this association, as evidenced by the r-squared value of 0.9183265, indicating that over 91% of the variation in EXR stock price can be explained by the popularity of the name "Kodi." It seems that Kodi's impact on the market is as undeniable as a dad joke's impact at a family dinner.
Furthermore, the p-value of less than 0.01 underscores the statistical significance of this finding. This p-value is lower than the number of puns in this paper, and that's saying something in a study that has us all tickled by an unexpected correlation.
These results not only emphasize the surprising connection between nomenclature and market dynamics but also emphasize the importance of keeping an open mind when exploring statistical relationships. It may seem like an odd pairing, but just as unexpected connections can be made between names and stocks, unexpected laughter can be found in a good dad joke.
-------
Your response should start like this:
[[DISCUSSION]]
ChatGPT:
[[DISCUSSION]]
Our findings present a compelling case for the impact of the name "Kodi" on the stock price of Extra Space Storage (EXR). The remarkably high correlation coefficient of 0.9582935, along with a p-value of less than 0.01, underscores the statistical significance of this unexpected relationship. It seems that the rise and fall of the name "Kodi" may indeed hold some sway over the market dynamics of EXR. This correlation might just be the name of the game in stock market analysis. After all, as the saying goes, "Kodi's name knack might be knackering the stock price."
Our results align with prior research that has delved into the intriguing interplay between nomenclature and economic phenomena. Smith's (2010) exploration of personal names and consumer behavior provides a foundation for understanding the possible influence of a name like "Kodi" on market dynamics. Similarly, Doe's (2015) examination of naming conventions and stock valuation becomes all the more pertinent in light of our findings. As our study unearthed a substantial correlation, it appears that the influence of nomenclature on financial markets extends beyond what meets the initial eye. Just like a good dad joke, the impact may be surprising at first, but it ultimately leaves a lasting impression.
Even as we take this connection seriously, we cannot help but appreciate the unexpected sources that have informed our inquiry. The quirky influence of the back of shampoo bottles continues to remind us that in the universe of statistical analysis, there's always space for a good laugh. Our findings align with the lighthearted yet substantial perspective offered by Levitt and Dubner's "Freakonomics" and Tetlock and Gardner's "Superforecasting: The Art and Science of Prediction." It seems that in the realm of economic and financial outcomes, the unexpected factors are as diverse and delightful as the assortment of dad jokes at a family gathering.
The robust relationship between the popularity of the name "Kodi" and the stock price of EXR not only adds an entertaining twist to market analysis but also underscores the need for broader perspectives in understanding statistical relationships. Just as the unexpected connection between nomenclature and stock performance emerged in our study, unexpected laughter has found its place in the serious world of economic research. In the end, it appears that understanding market trends is not just about storage—it's about keeping an open mind to unexpected correlations and a good pun or two.
Model: gpt-3.5-turbo-1106
System prompt: You are a witty academic researcher. Your writing sounds like it belongs in a statistics journal.You draft the discussion section of goofy academic research papers that sounds like it belongs based on the title and abstract provided.
User prompt:
Pretend you are an academic researcher. Your writing sounds like it belongs in a medical or economics journal. However, you frequently crack jokes, make puns, or add unexpected twists in your writing.
Please make up a short conclusion of an academic research paper presenting the findings of the connection between Popularity of the first name Kodi and Extra Space Storage's stock price (EXR). You can't resist a good dad joke. Add a relevant dad joke related to the content every couple of sentences.
Limit your response to 300 tokens. At the very end, assert that no more research is needed in this area.
Here are the title, abstract, introduction, and results sections.
[[TITLE]]
Kodi's Name Knack and EXR: Exploring the Entertaining Econometrics
[[ABSTRACT]]
In this study, we endeavor to explore the perplexing yet surprisingly punderful connection between the popularity of the first name "Kodi" and the stock price of Extra Space Storage (EXR). By harnessing data from the US Social Security Administration and LSEG Analytics (Refinitiv), our research team conducted a comprehensive analysis spanning the years 2005 to 2022.
Unveiling a remarkable correlation coefficient of 0.9582935 and a p-value of less than 0.01, our findings suggest a notably strong relationship between the popularity of the name "Kodi" and the fluctuations in EXR stock price. As we delved deeper into this trend, we couldn't help but ask, "Is the influx of Kodi's influencing EXR or is EXR's performance simply attracting more Kodi's?"
Our results hint at the striking possibility that the rise and fall of the name "Kodi" might hold some sway over the market dynamics of EXR. This correlation, while surprising, is a reminder that in the world of statistics, unexpected relationships may emerge when least expected – and sometimes, a good dad joke accompanies them.
In conclusion, our study brings to light an eye-opening correlation between the popularity of a first name and a stock's performance, offering a refreshing twist on the usual market analysis. This research embraces the comical side of numbers, showcasing how even in the world of statistics, there's always room for a good pun. After all, understanding market trends doesn't have to be a storage.
[[INTRDUCTION]]
As the saying goes, "What's in a name?" Well, according to our research, quite a bit when it comes to the peculiar correlation between the popularity of the first name "Kodi" and the stock price of Extra Space Storage (EXR). This study delves into the intriguing intersection of nomenclature and economics, uncovering a connection that is as unexpected as it is entertaining.
The notion that a simple name could hold sway over the financial performance of a company might seem as far-fetched as a storage unit filled with dad jokes, yet our findings suggest otherwise. We've nicknamed this phenomenon the "Kodi Effect," and its impact on EXR stock has left us both bewildered and bemused. It's a pun-derful world, indeed.
When we began this study, our team couldn't help but wonder, "What's in a name and a ticker symbol?" Our curiosity led us to analyze data from the US Social Security Administration, tracing the fluctuations in the popularity of the name "Kodi" from 2005 to 2022. We then turned our attention to the stock market, where we gleaned EXR's price movements from LSEG Analytics (Refinitiv), hoping to unravel the whimsically intertwined tale of Kodi and EXR.
As we crunched the numbers and uncovered a correlation coefficient of 0.9582935 coupled with a p-value of less than 0.01, we couldn't help but smile at the statistical significance. It seems that the "Kodi Effect" is more than just a clever play on words; it's a statistical enigma that raises eyebrows almost as much as it raises stock prices.
So, what exactly does this mean for the world of finance and for parents pondering the perfect name for their offspring? Is the rise of Kodi a harbinger of bullish trends for EXR, or is it simply a case of serendipitous nomenclature? These questions keep us pondering the whims of the market and the witticisms of statistics with a wry grin – after all, every good paper needs a pun-damental twist.
Our study offers a humorous yet genuinely surprising exploration of the crossroads between nomenclature and market dynamics. By shedding light on this comical correlation, we hope to add a touch of whimsy to the world of economics and finance. It appears that in the realm of statistics, there's always a place for a good dad joke, especially when it comes to understanding market trends. In this study, we're proving that even in the world of statistics, laughter and learning can go hand in hand. Just remember, when it comes to market trends, laughter is the best medicine.
[[RESULTS]]
In the period from 2005 to 2022, a thorough analysis revealed a strikingly high correlation coefficient of 0.9582935 between the popularity of the first name "Kodi" and the stock price of Extra Space Storage (EXR). Our study suggests that there's more to a name than meets the eye, and perhaps also more to a stock price than meets the tick-er.
Fig. 1 depicts the scatterplot illustrating the robust positive relationship between the frequency of the name "Kodi" and EXR's stock price. As the saying goes, a picture is worth a thousand words, and in this case, it's worth at least a thousand chuckles - as long as you're open to a good pun.
The correlation coefficient of 0.9582935 signifies a remarkably strong relationship, almost as strong as the gravitational pull of an excellent pun. We can be fairly confident in this association, as evidenced by the r-squared value of 0.9183265, indicating that over 91% of the variation in EXR stock price can be explained by the popularity of the name "Kodi." It seems that Kodi's impact on the market is as undeniable as a dad joke's impact at a family dinner.
Furthermore, the p-value of less than 0.01 underscores the statistical significance of this finding. This p-value is lower than the number of puns in this paper, and that's saying something in a study that has us all tickled by an unexpected correlation.
These results not only emphasize the surprising connection between nomenclature and market dynamics but also emphasize the importance of keeping an open mind when exploring statistical relationships. It may seem like an odd pairing, but just as unexpected connections can be made between names and stocks, unexpected laughter can be found in a good dad joke.
-------
Your response should start like this:
[[CONCLUSION]]
ChatGPT:
[[CONCLUSION]]
In conclusion, our study has unveiled a compelling correlation between the popularity of the first name "Kodi" and the stock price of Extra Space Storage (EXR), shedding light on the pun-derful relationship between nomenclature and market dynamics. The surprising strength of the correlation coefficient of 0.9582935 has left us pondering the influence of Kodi on EXR's performance, proving once and for all that there's more to a name than mere letters - sometimes, there's a stock market connection.
As we close the lid on this investigation, it's worth noting that the statistical significance we've uncovered is as robust as a well-crafted, side-splitting dad joke. Our findings offer a whimsical twist to the world of finance, showcasing that even in the realm of numbers and trends, there's room for a hearty chuckle. It's clear that the "Kodi Effect" is more than just a play on words; it's a statistical enigma that warrants a place in the annals of economic research.
This study, with its unexpected humor and surprising results, presents a refreshing take on market analysis – showing that in the world of statistics, a humorous insight might just be as valuable as a financial one. After all, why did the statistician put a bed in their office? Because they wanted to be able to say they work with "ex-tents"! (Yes, we couldn't resist one final dad joke.)
As we sign off on this research, it is evident that no further exploration in this area is needed. Our findings have tickled our statistical funny bone and have provided enough evidence to affirm the influence of the name "Kodi" on the market dynamics of EXR. In the world of financial correlations, sometimes all it takes is a good sense of humor to find unexpected connections – statistical or otherwise.
In the immortal words of a statistician with a sense of humor, "Why don't we ever tell secrets on a farm?" Because the potatoes have eyes and the corn has ears! Thank you, and goodnight!
Model: gpt-3.5-turbo-1106
System prompt: You provide fictional names of academic journals. You say nothing else, and you do not chat with the user.
User prompt: Please provide the name of a funny but plausible sounding research, scientific, or academic journal that would publish a paper entited Kodi's Name Knack and EXR: Exploring the Entertaining Econometrics. Respond only with the name of a fictional academic journal.
ChatGPT:
The Journal of Comedic Economics and Statistical Analysis
Model: gpt-3.5-turbo-1106
System prompt: You provide fictional names of nonprofit research organizations and associations. You say nothing else, and you do not chat with the user.
User prompt: Please provide the name of a funny but plausible sounding nonprofit, academic, or scientific association or organization that would sponsor research that resulted in a paper entited Kodi's Name Knack and EXR: Exploring the Entertaining Econometrics. Respond only with the name of a fictional organization.
ChatGPT:
The Humor-Driven Research Institute
Model: gpt-3.5-turbo-1106
System prompt: You provide potential search keywords separated by commas. You say nothing else, and you do not chat with the user.
User prompt: Please provide potential search keywords for a paper titled Kodi's Name Knack and EXR: Exploring the Entertaining Econometrics with an abstract of In this study, we endeavor to explore the perplexing yet surprisingly punderful connection between the popularity of the first name "Kodi" and the stock price of Extra Space Storage (EXR). By harnessing data from the US Social Security Administration and LSEG Analytics (Refinitiv), our research team conducted a comprehensive analysis spanning the years 2005 to 2022.
Unveiling a remarkable correlation coefficient of 0.9582935 and a p-value of less than 0.01, our findings suggest a notably strong relationship between the popularity of the name "Kodi" and the fluctuations in EXR stock price. As we delved deeper into this trend, we couldn't help but ask, "Is the influx of Kodi's influencing EXR or is EXR's performance simply attracting more Kodi's?"
Our results hint at the striking possibility that the rise and fall of the name "Kodi" might hold some sway over the market dynamics of EXR. This correlation, while surprising, is a reminder that in the world of statistics, unexpected relationships may emerge when least expected – and sometimes, a good dad joke accompanies them.
In conclusion, our study brings to light an eye-opening correlation between the popularity of a first name and a stock's performance, offering a refreshing twist on the usual market analysis. This research embraces the comical side of numbers, showcasing how even in the world of statistics, there's always room for a good pun. After all, understanding market trends doesn't have to be a storage.
ChatGPT:
Kodi, first name popularity, Extra Space Storage, EXR stock price, US Social Security Administration data, LSEG Analytics, Refinitiv, correlation coefficient, market dynamics, econometrics, statistical analysis
*There is a bunch of Python happening behind the scenes to turn this prompt sequence into a PDF.
Discover a new correlation
View all correlations
View all research papers
Report an error
Data details
Popularity of the first name KodiDetailed data title: Babies of all sexes born in the US named Kodi
Source: US Social Security Administration
See what else correlates with Popularity of the first name Kodi
Extra Space Storage's stock price (EXR)
Detailed data title: Opening price of Extra Space Storage (EXR) on the first trading day of the year
Source: LSEG Analytics (Refinitiv)
Additional Info: Via Microsoft Excel Stockhistory function
See what else correlates with Extra Space Storage's stock price (EXR)
Correlation is a measure of how much the variables move together. If it is 0.99, when one goes up the other goes up. If it is 0.02, the connection is very weak or non-existent. If it is -0.99, then when one goes up the other goes down. If it is 1.00, you probably messed up your correlation function.
r2 = 0.9183265 (Coefficient of determination)
This means 91.8% of the change in the one variable (i.e., Extra Space Storage's stock price (EXR)) is predictable based on the change in the other (i.e., Popularity of the first name Kodi) over the 18 years from 2005 through 2022.
p < 0.01, which is statistically significant(Null hypothesis significance test)
The p-value is 4.04E-10. 0.0000000004037625033335015600
The p-value is a measure of how probable it is that we would randomly find a result this extreme. More specifically the p-value is a measure of how probable it is that we would randomly find a result this extreme if we had only tested one pair of variables one time.
But I am a p-villain. I absolutely did not test only one pair of variables one time. I correlated hundreds of millions of pairs of variables. I threw boatloads of data into an industrial-sized blender to find this correlation.
Who is going to stop me? p-value reporting doesn't require me to report how many calculations I had to go through in order to find a low p-value!
On average, you will find a correaltion as strong as 0.96 in 4.04E-8% of random cases. Said differently, if you correlated 2,476,703,487 random variables You don't actually need 2 billion variables to find a correlation like this one. I don't have that many variables in my database. You can also correlate variables that are not independent. I do this a lot.
p-value calculations are useful for understanding the probability of a result happening by chance. They are most useful when used to highlight the risk of a fluke outcome. For example, if you calculate a p-value of 0.30, the risk that the result is a fluke is high. It is good to know that! But there are lots of ways to get a p-value of less than 0.01, as evidenced by this project.
In this particular case, the values are so extreme as to be meaningless. That's why no one reports p-values with specificity after they drop below 0.01.
Just to be clear: I'm being completely transparent about the calculations. There is no math trickery. This is just how statistics shakes out when you calculate hundreds of millions of random correlations.
with the same 17 degrees of freedom, Degrees of freedom is a measure of how many free components we are testing. In this case it is 17 because we have two variables measured over a period of 18 years. It's just the number of years minus ( the number of variables minus one ), which in this case simplifies to the number of years minus one.
you would randomly expect to find a correlation as strong as this one.
[ 0.89, 0.98 ] 95% correlation confidence interval (using the Fisher z-transformation)
The confidence interval is an estimate the range of the value of the correlation coefficient, using the correlation itself as an input. The values are meant to be the low and high end of the correlation coefficient with 95% confidence.
This one is a bit more complciated than the other calculations, but I include it because many people have been pushing for confidence intervals instead of p-value calculations (for example: NEJM. However, if you are dredging data, you can reliably find yourself in the 5%. That's my goal!
All values for the years included above: If I were being very sneaky, I could trim years from the beginning or end of the datasets to increase the correlation on some pairs of variables. I don't do that because there are already plenty of correlations in my database without monkeying with the years.
Still, sometimes one of the variables has more years of data available than the other. This page only shows the overlapping years. To see all the years, click on "See what else correlates with..." link above.
| 2005 | 2006 | 2007 | 2008 | 2009 | 2010 | 2011 | 2012 | 2013 | 2014 | 2015 | 2016 | 2017 | 2018 | 2019 | 2020 | 2021 | 2022 | |
| Popularity of the first name Kodi (Babies born) | 120 | 118 | 110 | 139 | 137 | 125 | 126 | 131 | 135 | 139 | 145 | 160 | 175 | 217 | 224 | 204 | 258 | 351 |
| Extra Space Storage's stock price (EXR) (Stock price) | 13.35 | 15.54 | 18.43 | 14.2 | 10.34 | 11.75 | 17.52 | 24.51 | 36.81 | 42.09 | 58.72 | 87.73 | 77.25 | 87.75 | 90.11 | 105.88 | 115.73 | 227 |
Why this works
- Data dredging: I have 25,153 variables in my database. I compare all these variables against each other to find ones that randomly match up. That's 632,673,409 correlation calculations! This is called “data dredging.” Instead of starting with a hypothesis and testing it, I instead abused the data to see what correlations shake out. It’s a dangerous way to go about analysis, because any sufficiently large dataset will yield strong correlations completely at random.
- Lack of causal connection: There is probably
Because these pages are automatically generated, it's possible that the two variables you are viewing are in fact causually related. I take steps to prevent the obvious ones from showing on the site (I don't let data about the weather in one city correlate with the weather in a neighboring city, for example), but sometimes they still pop up. If they are related, cool! You found a loophole.
no direct connection between these variables, despite what the AI says above. This is exacerbated by the fact that I used "Years" as the base variable. Lots of things happen in a year that are not related to each other! Most studies would use something like "one person" in stead of "one year" to be the "thing" studied. - Observations not independent: For many variables, sequential years are not independent of each other. If a population of people is continuously doing something every day, there is no reason to think they would suddenly change how they are doing that thing on January 1. A simple
Personally I don't find any p-value calculation to be 'simple,' but you know what I mean.
p-value calculation does not take this into account, so mathematically it appears less probable than it really is.
Try it yourself
You can calculate the values on this page on your own! Try running the Python code to see the calculation results. Step 1: Download and install Python on your computer.Step 2: Open a plaintext editor like Notepad and paste the code below into it.
Step 3: Save the file as "calculate_correlation.py" in a place you will remember, like your desktop. Copy the file location to your clipboard. On Windows, you can right-click the file and click "Properties," and then copy what comes after "Location:" As an example, on my computer the location is "C:\Users\tyler\Desktop"
Step 4: Open a command line window. For example, by pressing start and typing "cmd" and them pressing enter.
Step 5: Install the required modules by typing "pip install numpy", then pressing enter, then typing "pip install scipy", then pressing enter.
Step 6: Navigate to the location where you saved the Python file by using the "cd" command. For example, I would type "cd C:\Users\tyler\Desktop" and push enter.
Step 7: Run the Python script by typing "python calculate_correlation.py"
If you run into any issues, I suggest asking ChatGPT to walk you through installing Python and running the code below on your system. Try this question:
"Walk me through installing Python on my computer to run a script that uses scipy and numpy. Go step-by-step and ask me to confirm before moving on. Start by asking me questions about my operating system so that you know how to proceed. Assume I want the simplest installation with the latest version of Python and that I do not currently have any of the necessary elements installed. Remember to only give me one step per response and confirm I have done it before proceeding."
# These modules make it easier to perform the calculation
import numpy as np
from scipy import stats

# We'll define a function that we can call to return the correlation calculations
def calculate_correlation(array1, array2):

    # Calculate Pearson correlation coefficient and p-value
    correlation, p_value = stats.pearsonr(array1, array2)

    # Calculate R-squared as the square of the correlation coefficient
    r_squared = correlation**2

    return correlation, r_squared, p_value

# These are the arrays for the variables shown on this page, but you can modify them to be any two sets of numbers
array_1 = np.array([120,118,110,139,137,125,126,131,135,139,145,160,175,217,224,204,258,351,])
array_2 = np.array([13.35,15.54,18.43,14.2,10.34,11.75,17.52,24.51,36.81,42.09,58.72,87.73,77.25,87.75,90.11,105.88,115.73,227,])
array_1_name = "Popularity of the first name Kodi"
array_2_name = "Extra Space Storage's stock price (EXR)"

# Perform the calculation
print(f"Calculating the correlation between {array_1_name} and {array_2_name}...")
correlation, r_squared, p_value = calculate_correlation(array_1, array_2)

# Print the results
print("Correlation Coefficient:", correlation)
print("R-squared:", r_squared)
print("P-value:", p_value)
Reuseable content
You may re-use the images on this page for any purpose, even commercial purposes, without asking for permission. The only requirement is that you attribute Tyler Vigen. Attribution can take many different forms. If you leave the "tylervigen.com" link in the image, that satisfies it just fine. If you remove it and move it to a footnote, that's fine too. You can also just write "Charts courtesy of Tyler Vigen" at the bottom of an article.You do not need to attribute "the spurious correlations website," and you don't even need to link here if you don't want to. I don't gain anything from pageviews. There are no ads on this site, there is nothing for sale, and I am not for hire.
For the record, I am just one person. Tyler Vigen, he/him/his. I do have degrees, but they should not go after my name unless you want to annoy my wife. If that is your goal, then go ahead and cite me as "Tyler Vigen, A.A. A.A.S. B.A. J.D." Otherwise it is just "Tyler Vigen."
When spoken, my last name is pronounced "vegan," like I don't eat meat.
Full license details.
For more on re-use permissions, or to get a signed release form, see tylervigen.com/permission.
Download images for these variables:
- High resolution line chart
The image linked here is a Scalable Vector Graphic (SVG). It is the highest resolution that is possible to achieve. It scales up beyond the size of the observable universe without pixelating. You do not need to email me asking if I have a higher resolution image. I do not. The physical limitations of our universe prevent me from providing you with an image that is any higher resolution than this one.
If you insert it into a PowerPoint presentation (a tool well-known for managing things that are the scale of the universe), you can right-click > "Ungroup" or "Create Shape" and then edit the lines and text directly. You can also change the colors this way.
Alternatively you can use a tool like Inkscape. - High resolution line chart, optimized for mobile
- Alternative high resolution line chart
- Scatterplot
- Portable line chart (png)
- Portable line chart (png), optimized for mobile
- Line chart for only Popularity of the first name Kodi
- Line chart for only Extra Space Storage's stock price (EXR)
- AI-generated correlation image
- The spurious research paper: Kodi's Name Knack and EXR: Exploring the Entertaining Econometrics
Your rating skills are legendary!
Correlation ID: 2639 · Black Variable ID: 3778 · Red Variable ID: 1850

