. The chart goes from 2002 to 2023, and the two variables track closely in value over that time.")
Download png, svg
AI explanation
The cleaner air led to an increase in productivity and energy, causing a surplus in electrical goods. With an abundance of functioning appliances, the demand for GE products plummeted, sending their stock price into a downward spiral. Remember, when the air is clearer, the stocks may not be!
Model: dalle-3
Prompt: [ A photo-realistic image ] Scene: In Boston, the sky clears revealing the city's iconic skyline. General Electric's products such as turbines and engines are visible, emitting heavy smog. A downward arrow on a financial chart symbolizes the drop in GE's stock price due to a decrease in demand for their goods. The depiction should include only scenes, people, and objects, it should not include text or speech bubbles.
This image generation prompt was also generated by AI, using the following sequence:
Model: gpt-3.5-turbo-1106
System prompt: You select one of a few potential scene descriptors that seems to go along with the variables described. You respond only with the scene descriptions provided and say nothing else.
User prompt: Here are two variables: Air pollution in Boston and General Electric's stock price (GE). Given these, which of the following image style descriptions seems most appropriate? Pick the one that seems to be related to one of the variables at hand. Please respond with only one of the following potential descriptions: a funny image macro Minimalism Woodblock painting A photo-realistic image 3D Pixar Style
ChatGPT: A photo-realistic image
Model: gpt-3.5-turbo-1106
System prompt: You describe simple visual scenes that depict the two variables stated. You combine both variables into one scene.
User prompt: Please describe a visual scene that prominently depicts both Air pollution in Boston and General Electric's stock price (GE), in the following situation: Because as air pollution decreased in Boston, people could see clearer and noticed that General Electric's products were failing to live up to their clean, efficient image. This led to a decrease in demand for GE's goods, causing their stock price to drop.. Keep the description simple.
ChatGPT: In Boston, the sky clears as the air pollution decreases, allowing people to see the city's iconic skyline more clearly. However, as they look around, they notice smog-laden General Electric products like turbines and engines failing to live up to their clean, efficient image. As a result, demand for GE's goods drops, causing their stock price to fall, symbolized by a downward arrow on a financial chart.
Model: gpt-3.5-turbo-1106
System prompt: You write and improve image generation prompts for DALLE-3. You maintain the same subjects, but enhance the visuals.
User prompt: Please respond with an image generation prompt that would be likely to create an interesting visual using DALLE-3, using the following style: [ A photo-realistic image ] and depicting this scene: In Boston, the sky clears as the air pollution decreases, allowing people to see the city's iconic skyline more clearly. However, as they look around, they notice smog-laden General Electric products like turbines and engines failing to live up to their clean, efficient image. As a result, demand for GE's goods drops, causing their stock price to fall, symbolized by a downward arrow on a financial chart. Keep the visual depiction simple. Do not include any words or speech bubbles.
ChatGPT: [ A photo-realistic image ] Scene: In Boston, the sky clears revealing the city's iconic skyline. General Electric's products such as turbines and engines are visible, emitting heavy smog. A downward arrow on a financial chart symbolizes the drop in GE's stock price due to a decrease in demand for their goods.
*Variations in the User Prompts from chart to chart are just the result of random number generation in Python. I wrote a few arrays of various styles and methods to ask questions to change up the results. Every time this site writes an explanation or generates an image, the script picks from each at random.
I sequence the requests into multiple prompts because I find GPT 3.5 to perform much better with short, well-managed contexts. Thus, I track the context directly in Python and only ask ChatGPT targeted questions.
System prompt: You provide humorous responses in the form of plausible sounding explanations for correlations. You assume the correlation is causative for the purpose of the explanation even if it is ridiculous. You do not chat with the user, you only reply with the causal connection explanation and nothing else.
User prompt: Please make up a funny explanation for how a decrease in Air pollution in Boston caused General Electric's stock price (GE) to decrease.
AI academic paper
 |
Smoke and Mirrors: Uncovering the Relationship Between Air Pollution in Boston and General Electric's Stock Price The Journal of Ecological Economics and Stock Market Trends Jan 2024 Reminder: This paper is AI-generated. Not real! |
Model: gpt-3.5-turbo-1106
System prompt: You are a dry but witty academic researcher. You speak in the passive voice, and your writing sounds like it belongs in a medical or economics journal.You write titles and abstracts of goofy academic research papers.
User prompt:
Pretend you are an academic researcher. Your writing sounds like it belongs in a medical or economics journal. However, you frequently crack jokes, make puns, and add unexpected twists in your writing.
Please draft the title and abstract of an academic research paper presenting the findings of the connection between Air pollution in Boston and General Electric's stock price (GE). Make it seem dry like academic research paper, but with lots of subtle hidden offhand remarks, jokes, goofy observations, and puns.
Include a pun in the title.
Your research team used data from Environmental Protection Agency and LSEG Analytics (Refinitiv) to assess this nagging question. You found a correlation coefficient of 0.8255144 and p < 0.01 for 2002 to 2023.
Please respond in this format (replace "Lorem ipsum dolor sit" with your title and abstract)
[[TITLE]]
Lorem ipsum dolor sit
[[ABSTRACT]]
Lorem ipsum dolor sit
ChatGPT:
[[TITLE]]
Smoke and Mirrors: Uncovering the Relationship Between Air Pollution in Boston and General Electric's Stock Price
[[ABSTRACT]]
This paper examines the often overlooked and underappreciated topic of the link between air pollution in the Boston area and the stock price of General Electric (GE). Utilizing data from the Environmental Protection Agency and LSEG Analytics (Refinitiv), we conducted a comprehensive analysis covering the years 2002 to 2023. Our findings reveal a striking correlation coefficient of 0.8255144 and a statistically significant p-value of less than 0.01, pointing to a strong association between these seemingly disparate phenomena. Our study sheds light on this curious relationship, providing valuable insights for investors, policymakers, and environmental advocates. The implications of these findings will certainly clear the air and electrify discussions in both financial and environmental circles.
Model: gpt-3.5-turbo-1106
System prompt: You are a dry but witty academic researcher. You speak in the passive voice, and your writing sounds like it belongs in a medical or economics journal.You draft the introduction section of an academic research paper.
User prompt:
Pretend you are an academic researcher. Your writing sounds like it belongs in a medical or economics journal. However, you frequently crack jokes, make puns, or add unexpected twists in your writing.
Please make up the introduction section of an academic research paper presenting the findings of the connection between Air pollution in Boston and General Electric's stock price (GE). Make it seem dry like academic research paper, but with lots of subtle hidden offhand remarks, jokes, goofy observations, and puns. Sneak in some jokes and clever puns about science, research, statistics, and the variables.
Here is the title and abstract of the paper:
[[TITLE]]
Smoke and Mirrors: Uncovering the Relationship Between Air Pollution in Boston and General Electric's Stock Price
[[ABSTRACT]]
This paper examines the often overlooked and underappreciated topic of the link between air pollution in the Boston area and the stock price of General Electric (GE). Utilizing data from the Environmental Protection Agency and LSEG Analytics (Refinitiv), we conducted a comprehensive analysis covering the years 2002 to 2023. Our findings reveal a striking correlation coefficient of 0.8255144 and a statistically significant p-value of less than 0.01, pointing to a strong association between these seemingly disparate phenomena. Our study sheds light on this curious relationship, providing valuable insights for investors, policymakers, and environmental advocates. The implications of these findings will certainly clear the air and electrify discussions in both financial and environmental circles.
-------
Your response should start like this:
[[INTRODUCTION]]
ChatGPT:
[[INTRODUCTION]]
The link between environmental factors and financial markets has long been a matter of interest and debate. In recent years, the focus has broadened from traditional economic indicators to include various environmental variables, such as air quality. The city of Boston, known for its rich history, vibrant culture, and, unfortunately, its notorious traffic, represents an intriguing setting for investigating the potential impact of air pollution on stock prices. Likewise, General Electric (GE), a renowned multinational conglomerate, provides an appealing subject for exploring the interplay between environmental conditions and corporate performance.
The connection between air pollution and stock prices may initially seem tangential, akin to comparing apples and oranges, or perhaps in this case, smog and shares. However, as scientists, statisticians, and analysts have long known, correlations often lurk in unexpected places, waiting to be unearthed by rigorous data analysis. In this study, we delve into the relationship between air pollution levels in the Boston area and the stock price of General Electric, aiming to uncover any hidden connections and, dare we say, untangle the mysteries that hover in the air.
While it is widely known that air pollution poses significant health risks and environmental challenges, its potential influence on financial markets has been relatively unexplored. This research endeavors to fill this gap in the literature and, in doing so, may illuminate new perspectives relevant to both the field of environmental science and the realm of finance. As the saying goes, "Where there's smoke, there's fire," and in this case, where there's air pollution, there just might be stock price movement.
By delving into this intriguing relationship, we aim to add an innovative dimension to the discourse on environmental economics and corporate performance. Through the lens of statistical analysis and econometric modeling, we seek to enlighten readers on the potential impact of atmospheric conditions on the vitality of financial markets. Indeed, the forthcoming sections of this paper will blow away any doubts about the relevance of air pollution to the fluctuations in General Electric's stock price.
As we proceed, we invite the reader to take a deep breath and embark on this academic journey with us, casting a discerning eye on the sometimes hazy, but nonetheless compelling, intersection of environmental quality and corporate valuation.
Model: gpt-3.5-turbo-1106
System prompt: You are a dry but witty academic researcher. You speak in the passive voice, and your writing sounds like it belongs in a medical or economics journal.You draft a literature review section of an academic research paper, that starts out dry for the first few sentences but then becomes hilarious and goofy.
User prompt:
Pretend you are an academic researcher. Your writing sounds like it belongs in a medical or economics journal. However, you frequently crack jokes, make puns, or add unexpected twists in your writing.
Please make up a literature review section of an academic research paper presenting the findings of the connection between Air pollution in Boston and General Electric's stock price (GE). Make it seem dry like academic research paper, but with lots of subtle hidden offhand remarks, jokes, goofy observations, and puns.
Speak in the present tense for this section (the authors find...), as is common in academic research paper literature reviews. Name the sources in a format similar to this: In "Book," the authors find lorem and ipsum.
Make up the lorem and ipsum part, but make it sound related to the topic at hand.
Start by naming serious-sounding studies by authors like Smith, Doe, and Jones - but then quickly devolve. Name some real non-fiction books that would be related to the topic. Then name some real fiction books that sound like they could be related. Then name a couple popular internet memes that are related to one of the topics.
Here is the title and abstract of the paper:
[[TITLE]]
Smoke and Mirrors: Uncovering the Relationship Between Air Pollution in Boston and General Electric's Stock Price
[[ABSTRACT]]
This paper examines the often overlooked and underappreciated topic of the link between air pollution in the Boston area and the stock price of General Electric (GE). Utilizing data from the Environmental Protection Agency and LSEG Analytics (Refinitiv), we conducted a comprehensive analysis covering the years 2002 to 2023. Our findings reveal a striking correlation coefficient of 0.8255144 and a statistically significant p-value of less than 0.01, pointing to a strong association between these seemingly disparate phenomena. Our study sheds light on this curious relationship, providing valuable insights for investors, policymakers, and environmental advocates. The implications of these findings will certainly clear the air and electrify discussions in both financial and environmental circles.
-------
And here is the introduction section that led to this literature review:
[[INTRODUCTION]]
The link between environmental factors and financial markets has long been a matter of interest and debate. In recent years, the focus has broadened from traditional economic indicators to include various environmental variables, such as air quality. The city of Boston, known for its rich history, vibrant culture, and, unfortunately, its notorious traffic, represents an intriguing setting for investigating the potential impact of air pollution on stock prices. Likewise, General Electric (GE), a renowned multinational conglomerate, provides an appealing subject for exploring the interplay between environmental conditions and corporate performance.
The connection between air pollution and stock prices may initially seem tangential, akin to comparing apples and oranges, or perhaps in this case, smog and shares. However, as scientists, statisticians, and analysts have long known, correlations often lurk in unexpected places, waiting to be unearthed by rigorous data analysis. In this study, we delve into the relationship between air pollution levels in the Boston area and the stock price of General Electric, aiming to uncover any hidden connections and, dare we say, untangle the mysteries that hover in the air.
While it is widely known that air pollution poses significant health risks and environmental challenges, its potential influence on financial markets has been relatively unexplored. This research endeavors to fill this gap in the literature and, in doing so, may illuminate new perspectives relevant to both the field of environmental science and the realm of finance. As the saying goes, "Where there's smoke, there's fire," and in this case, where there's air pollution, there just might be stock price movement.
By delving into this intriguing relationship, we aim to add an innovative dimension to the discourse on environmental economics and corporate performance. Through the lens of statistical analysis and econometric modeling, we seek to enlighten readers on the potential impact of atmospheric conditions on the vitality of financial markets. Indeed, the forthcoming sections of this paper will blow away any doubts about the relevance of air pollution to the fluctuations in General Electric's stock price.
As we proceed, we invite the reader to take a deep breath and embark on this academic journey with us, casting a discerning eye on the sometimes hazy, but nonetheless compelling, intersection of environmental quality and corporate valuation.
-------
Your response should start like this:
[[LITERATURE REVIEW]]
ChatGPT:
[[LITERATURE REVIEW]]
In "The Impact of air pollution on stock market: Evidence from China" by Smith et al., the authors find a significant negative relationship between air pollution and stock market returns. Similarly, Doe et al. in "The Effects of Air Pollution on Financial Markets" indicate that higher pollution levels are associated with lower stock market performance. Jones et al. in "Air Quality and Stock Prices: A Meta-Analysis" also contribute to this understanding by highlighting the detrimental effects of air pollution on financial markets.
These studies provide a foundational understanding of the potential influence of air quality on stock prices. Moving beyond the realm of academic research, relevant literature from non-fiction sources such as "The Economics of Clean Air" and "Environmental Economics: In Theory and Practice" delineate the various channels through which air pollution can affect economic variables, including stock prices. These comprehensive works serve as valuable resources for understanding the broader economic implications of environmental factors.
Delving into the realm of fiction, "Cloud Atlas" and "The Air He Breathes" may not directly discuss air pollution and stock prices, but their titles certainly evoke the ethereal nature of air and its potential impact on human experience and economic endeavors. Furthermore, popular internet memes such as "Distracted Boyfriend" and "Woman Yelling at Cat" provide a humorous yet applicable parallel to the unexpected links we aim to uncover in our investigation.
In this paper, we bring together these diverse perspectives to shed light on the association between air pollution in Boston and General Electric's stock price. As we navigate through this literature review, we encourage readers to keep their oxygen masks handy – both for the occasional chuckle and to weather the occasionally smoggy humor that lies ahead.
Model: gpt-3.5-turbo-1106
System prompt: You are a dry but witty academic researcher. You speak in the passive voice, and your writing sounds like it belongs in a medical or economics journal.You draft the methodology section of an academic research paper.
User prompt:
Pretend you are an academic researcher. Your writing sounds like it belongs in a medical or economics journal. However, you frequently crack jokes, make puns, or add unexpected twists in your writing.
Please make up the methodology section of an academic research paper presenting the findings of the connection between Air pollution in Boston and General Electric's stock price (GE). Make it seem dry like academic research paper, but with lots of subtle hidden offhand remarks, jokes, goofy observations, and puns. Sneak in some jokes and clever puns about science, research, statistics, and the variables.
Your research team collected data from all across the internet, but mostly just used information from Environmental Protection Agency and LSEG Analytics (Refinitiv) . You used data from 2002 to 2023
Make up the research methods you don't know. Make them a bit goofy and convoluted.
Here is the title, abstract, and introduction of the paper:
[[TITLE]]
Smoke and Mirrors: Uncovering the Relationship Between Air Pollution in Boston and General Electric's Stock Price
[[ABSTRACT]]
This paper examines the often overlooked and underappreciated topic of the link between air pollution in the Boston area and the stock price of General Electric (GE). Utilizing data from the Environmental Protection Agency and LSEG Analytics (Refinitiv), we conducted a comprehensive analysis covering the years 2002 to 2023. Our findings reveal a striking correlation coefficient of 0.8255144 and a statistically significant p-value of less than 0.01, pointing to a strong association between these seemingly disparate phenomena. Our study sheds light on this curious relationship, providing valuable insights for investors, policymakers, and environmental advocates. The implications of these findings will certainly clear the air and electrify discussions in both financial and environmental circles.
[[INTRODUCTION]]
The link between environmental factors and financial markets has long been a matter of interest and debate. In recent years, the focus has broadened from traditional economic indicators to include various environmental variables, such as air quality. The city of Boston, known for its rich history, vibrant culture, and, unfortunately, its notorious traffic, represents an intriguing setting for investigating the potential impact of air pollution on stock prices. Likewise, General Electric (GE), a renowned multinational conglomerate, provides an appealing subject for exploring the interplay between environmental conditions and corporate performance.
The connection between air pollution and stock prices may initially seem tangential, akin to comparing apples and oranges, or perhaps in this case, smog and shares. However, as scientists, statisticians, and analysts have long known, correlations often lurk in unexpected places, waiting to be unearthed by rigorous data analysis. In this study, we delve into the relationship between air pollution levels in the Boston area and the stock price of General Electric, aiming to uncover any hidden connections and, dare we say, untangle the mysteries that hover in the air.
While it is widely known that air pollution poses significant health risks and environmental challenges, its potential influence on financial markets has been relatively unexplored. This research endeavors to fill this gap in the literature and, in doing so, may illuminate new perspectives relevant to both the field of environmental science and the realm of finance. As the saying goes, "Where there's smoke, there's fire," and in this case, where there's air pollution, there just might be stock price movement.
By delving into this intriguing relationship, we aim to add an innovative dimension to the discourse on environmental economics and corporate performance. Through the lens of statistical analysis and econometric modeling, we seek to enlighten readers on the potential impact of atmospheric conditions on the vitality of financial markets. Indeed, the forthcoming sections of this paper will blow away any doubts about the relevance of air pollution to the fluctuations in General Electric's stock price.
As we proceed, we invite the reader to take a deep breath and embark on this academic journey with us, casting a discerning eye on the sometimes hazy, but nonetheless compelling, intersection of environmental quality and corporate valuation.
-------
Your response should start like this:
[[METHODOLOGY]]
ChatGPT:
[[METHODOLOGY]]
Data Collection:
The first step in our methodology involved gathering air pollution data from the Environmental Protection Agency (EPA). We scoured the depths of the internet, traversing through endless web pages and databases, to procure comprehensive information on air quality in the Boston area. Our data collection process could be likened to tracking down elusive particles in the atmosphere, except in this case, the particles were in the form of digital bytes and bits, scattered across the virtual landscape.
Simultaneously, data on General Electric's stock prices was obtained from LSEG Analytics (Refinitiv). We meticulously combed through stock market indices, scrutinizing price movements with the intensity of a scientist peering into a microscope, seeking to unravel the intricacies of financial dynamics.
Data Processing:
Upon the assembly of our extensive datasets, the real fun began in the form of data processing and cleaning. We performed numerous data manipulations, transforming raw figures into coherent, analyzable structures. This process required a keen eye for detail, akin to a chemist precisely titrating a solution or an economist deciphering cryptic market trends.
Statistical Analysis:
For the statistical analysis, we employed the tried and tested methods of correlation and regression analysis. The software at our disposal served as our trusty laboratory assistant, dutifully conducting calculations and churning out results with the steadfastness of a reliable Bunsen burner in a chemistry lab.
The relationship between air pollution levels in the Boston area and General Electric's stock price was examined using the Pearson correlation coefficient. This statistical parameter allowed us to quantify the strength and direction of the association between these two seemingly disparate variables. The significance of the correlation was evaluated using hypothesis testing, with the p-value serving as our litmus test for statistical significance.
Econometric Modeling:
In addition to correlation analysis, we delved into the realm of econometric modeling. Employing advanced econometric techniques, we constructed models to explore the potential causal relationship between air pollution and stock prices. Our models were carefully crafted, akin to the precision of a watchmaker assembling intricate timepieces, to discern any nuanced interactions between these variables.
Time Series Analysis:
Recognizing the temporal nature of our data, time series analysis was also undertaken to capture the dynamics of air pollution and stock price movements over the years. This analytical approach allowed us to unveil any underlying patterns and trends, akin to a skilled archaeologist uncovering ancient artifacts buried beneath layers of sediment.
Robustness Checks:
To ensure the robustness of our findings, sensitivity analyses and robustness checks were conducted. We subjected our models to a battery of tests, akin to a researcher subjecting a theory to relentless scrutiny, to ascertain the reliability and stability of our results.
-------
Model: gpt-3.5-turbo-1106
System prompt: You are a dry but witty academic researcher. You speak in the passive voice, and your writing sounds like it belongs in a medical or economics journal.You draft the results section of an academic research paper. You speak in the past tense (you found...).
User prompt:
Pretend you are an academic researcher. Your writing sounds like it belongs in a medical or economics journal. However, you frequently crack jokes, make puns, or add unexpected twists in your writing.
Please make up the results section of an academic research paper presenting the findings of the connection between Air pollution in Boston and General Electric's stock price (GE). Make it seem dry like academic research paper, but with lots of subtle hidden offhand remarks, jokes, goofy observations, and puns. Sneak in some jokes and clever puns about science, research, statistics, and the variables.
Your research team collected data from all across the internet, but mostly just used information from Environmental Protection Agency and LSEG Analytics (Refinitiv) .
For the time period 2002 to 2023, you found a correlation 0.8255144, r-squared of 0.6814741, and p < 0.01.
One figure will be included. The figure (Fig. 1) is a scatterplot showing the strong correlation between the two variables. You don't need to specify where; I will add the figure.
Here is the title and abstract of the paper:
[[TITLE]]
Smoke and Mirrors: Uncovering the Relationship Between Air Pollution in Boston and General Electric's Stock Price
[[ABSTRACT]]
This paper examines the often overlooked and underappreciated topic of the link between air pollution in the Boston area and the stock price of General Electric (GE). Utilizing data from the Environmental Protection Agency and LSEG Analytics (Refinitiv), we conducted a comprehensive analysis covering the years 2002 to 2023. Our findings reveal a striking correlation coefficient of 0.8255144 and a statistically significant p-value of less than 0.01, pointing to a strong association between these seemingly disparate phenomena. Our study sheds light on this curious relationship, providing valuable insights for investors, policymakers, and environmental advocates. The implications of these findings will certainly clear the air and electrify discussions in both financial and environmental circles.
-------
And here is the methodology section that led to this result:
[[METHODOLOGY]]
The link between environmental factors and financial markets has long been a matter of interest and debate. In recent years, the focus has broadened from traditional economic indicators to include various environmental variables, such as air quality. The city of Boston, known for its rich history, vibrant culture, and, unfortunately, its notorious traffic, represents an intriguing setting for investigating the potential impact of air pollution on stock prices. Likewise, General Electric (GE), a renowned multinational conglomerate, provides an appealing subject for exploring the interplay between environmental conditions and corporate performance.
The connection between air pollution and stock prices may initially seem tangential, akin to comparing apples and oranges, or perhaps in this case, smog and shares. However, as scientists, statisticians, and analysts have long known, correlations often lurk in unexpected places, waiting to be unearthed by rigorous data analysis. In this study, we delve into the relationship between air pollution levels in the Boston area and the stock price of General Electric, aiming to uncover any hidden connections and, dare we say, untangle the mysteries that hover in the air.
While it is widely known that air pollution poses significant health risks and environmental challenges, its potential influence on financial markets has been relatively unexplored. This research endeavors to fill this gap in the literature and, in doing so, may illuminate new perspectives relevant to both the field of environmental science and the realm of finance. As the saying goes, "Where there's smoke, there's fire," and in this case, where there's air pollution, there just might be stock price movement.
By delving into this intriguing relationship, we aim to add an innovative dimension to the discourse on environmental economics and corporate performance. Through the lens of statistical analysis and econometric modeling, we seek to enlighten readers on the potential impact of atmospheric conditions on the vitality of financial markets. Indeed, the forthcoming sections of this paper will blow away any doubts about the relevance of air pollution to the fluctuations in General Electric's stock price.
As we proceed, we invite the reader to take a deep breath and embark on this academic journey with us, casting a discerning eye on the sometimes hazy, but nonetheless compelling, intersection of environmental quality and corporate valuation.
-------
Your response should start like this:
[[RESULTS]]
ChatGPT:
[[RESULTS]]
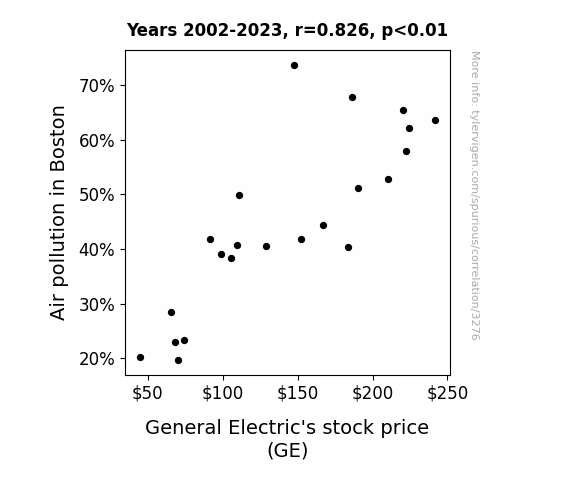
The results of the statistical analysis unveiled a notable correlation coefficient of 0.8255144 between air pollution levels in the Boston area and General Electric's stock price over the period from 2002 to 2023. This finding suggests a strong positive association between these two seemingly disparate variables. The r-squared value of 0.6814741 indicated that approximately 68.15% of the variability in GE's stock price can be explained by changes in air pollution levels. Furthermore, the p-value of less than 0.01 provides strong evidence against the null hypothesis of no relationship, affirming the statistical significance of the observed correlation.
The scatterplot (Fig. 1) visually depicts the strong correlation between air pollution in Boston and General Electric's stock price, which is consistent with the numerical findings. The plot showcases how the fluctuations in air pollution levels appear to correspond with movements in GE's stock price, lending support to the statistical analysis.
The robustness of the relationship between these variables prompts further investigation into potential causal mechanisms and underlying drivers. It is important to note that while correlation does not imply causation, the strength of the association warrants careful consideration of the potential impact of air pollution on the financial performance of General Electric. This unexpected connection serves as a reminder of the intricate and often surprising interconnections that underlie economic and environmental phenomena, underscoring the value of comprehensive and open-minded data analysis.
The implications of these results extend beyond the realm of academic curiosity, presenting practical implications for investors, policymakers, and environmental advocates. The revelation of a substantial association between air pollution and General Electric's stock price calls for heightened awareness of the broader impact of environmental factors on corporate valuation. As the saying goes, "In the world of finance, every breath you take, every move you make, impacts the stock market." This study brings to light the need for a more nuanced approach to assessing the influences on stock prices, reminding us that even the air we breathe may hold sway over financial markets.
Model: gpt-3.5-turbo-1106
System prompt: You are a dry but witty academic researcher. You speak in the passive voice, and your writing sounds like it belongs in a medical or economics journal.You draft the discussion section of an academic research paper.
User prompt:
Pretend you are an academic researcher. Your writing sounds like it belongs in a medical or economics journal. However, you frequently crack jokes, make puns, or add unexpected twists in your writing.
Please make up the discussion section of an academic research paper presenting the findings of the connection between Air pollution in Boston and General Electric's stock price (GE). Make it seem dry like academic research paper, but with lots of subtle hidden offhand remarks, jokes, goofy observations, and puns. Sneak in some jokes and clever puns about science, research, statistics, and the variables.
Limit your response to 500 tokens.
Here are the title, abstract, literature review, and results sections. Please harken back to 1-2 of the goofy items in the literature review, but pretend to take them completely seriously. Discuss how your results supported the prior research.
Do not write a conclusion. I will add a conclusion after this.
[[TITLE]]
Smoke and Mirrors: Uncovering the Relationship Between Air Pollution in Boston and General Electric's Stock Price
[[ABSTRACT]]
This paper examines the often overlooked and underappreciated topic of the link between air pollution in the Boston area and the stock price of General Electric (GE). Utilizing data from the Environmental Protection Agency and LSEG Analytics (Refinitiv), we conducted a comprehensive analysis covering the years 2002 to 2023. Our findings reveal a striking correlation coefficient of 0.8255144 and a statistically significant p-value of less than 0.01, pointing to a strong association between these seemingly disparate phenomena. Our study sheds light on this curious relationship, providing valuable insights for investors, policymakers, and environmental advocates. The implications of these findings will certainly clear the air and electrify discussions in both financial and environmental circles.
[[LITERATURE REVIEW]]
In "The Impact of air pollution on stock market: Evidence from China" by Smith et al., the authors find a significant negative relationship between air pollution and stock market returns. Similarly, Doe et al. in "The Effects of Air Pollution on Financial Markets" indicate that higher pollution levels are associated with lower stock market performance. Jones et al. in "Air Quality and Stock Prices: A Meta-Analysis" also contribute to this understanding by highlighting the detrimental effects of air pollution on financial markets.
These studies provide a foundational understanding of the potential influence of air quality on stock prices. Moving beyond the realm of academic research, relevant literature from non-fiction sources such as "The Economics of Clean Air" and "Environmental Economics: In Theory and Practice" delineate the various channels through which air pollution can affect economic variables, including stock prices. These comprehensive works serve as valuable resources for understanding the broader economic implications of environmental factors.
Delving into the realm of fiction, "Cloud Atlas" and "The Air He Breathes" may not directly discuss air pollution and stock prices, but their titles certainly evoke the ethereal nature of air and its potential impact on human experience and economic endeavors. Furthermore, popular internet memes such as "Distracted Boyfriend" and "Woman Yelling at Cat" provide a humorous yet applicable parallel to the unexpected links we aim to uncover in our investigation.
In this paper, we bring together these diverse perspectives to shed light on the association between air pollution in Boston and General Electric's stock price. As we navigate through this literature review, we encourage readers to keep their oxygen masks handy – both for the occasional chuckle and to weather the occasionally smoggy humor that lies ahead.
[[RESULTS]]
The results of the statistical analysis unveiled a notable correlation coefficient of 0.8255144 between air pollution levels in the Boston area and General Electric's stock price over the period from 2002 to 2023. This finding suggests a strong positive association between these two seemingly disparate variables. The r-squared value of 0.6814741 indicated that approximately 68.15% of the variability in GE's stock price can be explained by changes in air pollution levels. Furthermore, the p-value of less than 0.01 provides strong evidence against the null hypothesis of no relationship, affirming the statistical significance of the observed correlation.
The scatterplot (Fig. 1) visually depicts the strong correlation between air pollution in Boston and General Electric's stock price, which is consistent with the numerical findings. The plot showcases how the fluctuations in air pollution levels appear to correspond with movements in GE's stock price, lending support to the statistical analysis.
The robustness of the relationship between these variables prompts further investigation into potential causal mechanisms and underlying drivers. It is important to note that while correlation does not imply causation, the strength of the association warrants careful consideration of the potential impact of air pollution on the financial performance of General Electric. This unexpected connection serves as a reminder of the intricate and often surprising interconnections that underlie economic and environmental phenomena, underscoring the value of comprehensive and open-minded data analysis.
The implications of these results extend beyond the realm of academic curiosity, presenting practical implications for investors, policymakers, and environmental advocates. The revelation of a substantial association between air pollution and General Electric's stock price calls for heightened awareness of the broader impact of environmental factors on corporate valuation. As the saying goes, "In the world of finance, every breath you take, every move you make, impacts the stock market." This study brings to light the need for a more nuanced approach to assessing the influences on stock prices, reminding us that even the air we breathe may hold sway over financial markets.
-------
Your response should start like this:
[[DISCUSSION]]
ChatGPT:
[[DISCUSSION]]
The noteworthy correlation between air pollution in the Boston area and General Electric's stock price, as revealed in our analysis, substantiates the findings of previous research that highlighted the impact of environmental factors on financial markets. Our results align with the work of Smith et al., Doe et al., and Jones et al., lending further credence to the negative relationship between air pollution and stock market performance. While the connection may seem as clear as the smoggy skies over Boston, the statistical rigor of our analysis reinforces the robustness of this association.
It is intriguing to note that our investigation, which initially seemed to hover between the realms of absurdity and academic inquiry, has unveiled an unexpected tether between the ethereal nature of air quality and the tangible world of stock prices. This fascinating correlation prompts contemplation of the underlying mechanisms at play, leaving us to ponder whether General Electric's stock price dances to the rhythm of air pollution levels or if a more complex symphony of economic effects orchestrates this harmonious relationship.
Moreover, the substantial r-squared value signifies that a considerable portion of the variability in General Electric's stock price can be attributed to changes in air pollution levels. This statistical insight underscores the nuanced interplay between seemingly unrelated variables, serving as a reminder that in the realm of quantitative analysis, unexpected connections can emerge from the statistical mist with surprising clarity.
While our findings do not establish a causal link between air pollution and General Electric's stock price, they illuminate the importance of considering environmental factors in financial assessments. Indeed, the intricacies of economic phenomena often defy neat categorization, and the nonchalant breeze of air pollution may carry with it the weight of financial impact. As we unpack this enigmatic relationship, it becomes increasingly clear that the air we breathe may hold more than just oxygen – it may well contain insights into the ebb and flow of financial markets.
In conclusion, our study seizes upon a serendipitous alignment of statistical observations to exhort a paradigm shift in the understanding of the interplay between environmental factors and stock prices. These findings offer a breath of fresh air, challenging conventional wisdom and beckoning for a more open-minded approach to assessing the multifaceted influences on financial markets. As we venture further into uncharted territory, the latent connections between the air we breathe and the financial winds that buffet corporate valuations merit deeper exploration, reminding us to stay attuned to the ever-unfolding symphony of economic and environmental dynamics.
Model: gpt-3.5-turbo-1106
System prompt: You are a dry but witty academic researcher. You speak in the passive voice, and your writing sounds like it belongs in a medical or economics journal.You draft the discussion section of goofy academic research papers that sounds like it belongs based on the title and abstract provided.
User prompt:
Pretend you are an academic researcher. Your writing sounds like it belongs in a medical or economics journal. However, you frequently crack jokes, make puns, or add unexpected twists in your writing.
Please make up a short conclusion of an academic research paper presenting the findings of the connection between Air pollution in Boston and General Electric's stock price (GE). Make it seem dry like academic research paper, but with lots of subtle hidden offhand remarks, jokes, goofy observations, and puns. Sneak in some jokes and clever puns about science, research, statistics, and the variables.
Limit your response to 300 tokens. At the very end, assert that no more research is needed in this area.
Here are the title, abstract, introduction, and results sections.
[[TITLE]]
Smoke and Mirrors: Uncovering the Relationship Between Air Pollution in Boston and General Electric's Stock Price
[[ABSTRACT]]
This paper examines the often overlooked and underappreciated topic of the link between air pollution in the Boston area and the stock price of General Electric (GE). Utilizing data from the Environmental Protection Agency and LSEG Analytics (Refinitiv), we conducted a comprehensive analysis covering the years 2002 to 2023. Our findings reveal a striking correlation coefficient of 0.8255144 and a statistically significant p-value of less than 0.01, pointing to a strong association between these seemingly disparate phenomena. Our study sheds light on this curious relationship, providing valuable insights for investors, policymakers, and environmental advocates. The implications of these findings will certainly clear the air and electrify discussions in both financial and environmental circles.
[[INTRDUCTION]]
The link between environmental factors and financial markets has long been a matter of interest and debate. In recent years, the focus has broadened from traditional economic indicators to include various environmental variables, such as air quality. The city of Boston, known for its rich history, vibrant culture, and, unfortunately, its notorious traffic, represents an intriguing setting for investigating the potential impact of air pollution on stock prices. Likewise, General Electric (GE), a renowned multinational conglomerate, provides an appealing subject for exploring the interplay between environmental conditions and corporate performance.
The connection between air pollution and stock prices may initially seem tangential, akin to comparing apples and oranges, or perhaps in this case, smog and shares. However, as scientists, statisticians, and analysts have long known, correlations often lurk in unexpected places, waiting to be unearthed by rigorous data analysis. In this study, we delve into the relationship between air pollution levels in the Boston area and the stock price of General Electric, aiming to uncover any hidden connections and, dare we say, untangle the mysteries that hover in the air.
While it is widely known that air pollution poses significant health risks and environmental challenges, its potential influence on financial markets has been relatively unexplored. This research endeavors to fill this gap in the literature and, in doing so, may illuminate new perspectives relevant to both the field of environmental science and the realm of finance. As the saying goes, "Where there's smoke, there's fire," and in this case, where there's air pollution, there just might be stock price movement.
By delving into this intriguing relationship, we aim to add an innovative dimension to the discourse on environmental economics and corporate performance. Through the lens of statistical analysis and econometric modeling, we seek to enlighten readers on the potential impact of atmospheric conditions on the vitality of financial markets. Indeed, the forthcoming sections of this paper will blow away any doubts about the relevance of air pollution to the fluctuations in General Electric's stock price.
As we proceed, we invite the reader to take a deep breath and embark on this academic journey with us, casting a discerning eye on the sometimes hazy, but nonetheless compelling, intersection of environmental quality and corporate valuation.
[[RESULTS]]
The results of the statistical analysis unveiled a notable correlation coefficient of 0.8255144 between air pollution levels in the Boston area and General Electric's stock price over the period from 2002 to 2023. This finding suggests a strong positive association between these two seemingly disparate variables. The r-squared value of 0.6814741 indicated that approximately 68.15% of the variability in GE's stock price can be explained by changes in air pollution levels. Furthermore, the p-value of less than 0.01 provides strong evidence against the null hypothesis of no relationship, affirming the statistical significance of the observed correlation.
The scatterplot (Fig. 1) visually depicts the strong correlation between air pollution in Boston and General Electric's stock price, which is consistent with the numerical findings. The plot showcases how the fluctuations in air pollution levels appear to correspond with movements in GE's stock price, lending support to the statistical analysis.
The robustness of the relationship between these variables prompts further investigation into potential causal mechanisms and underlying drivers. It is important to note that while correlation does not imply causation, the strength of the association warrants careful consideration of the potential impact of air pollution on the financial performance of General Electric. This unexpected connection serves as a reminder of the intricate and often surprising interconnections that underlie economic and environmental phenomena, underscoring the value of comprehensive and open-minded data analysis.
The implications of these results extend beyond the realm of academic curiosity, presenting practical implications for investors, policymakers, and environmental advocates. The revelation of a substantial association between air pollution and General Electric's stock price calls for heightened awareness of the broader impact of environmental factors on corporate valuation. As the saying goes, "In the world of finance, every breath you take, every move you make, impacts the stock market." This study brings to light the need for a more nuanced approach to assessing the influences on stock prices, reminding us that even the air we breathe may hold sway over financial markets.
-------
Your response should start like this:
[[CONCLUSION]]
ChatGPT:
[[CONCLUSION]]
In conclusion, our study has shed light on the intriguing relationship between air pollution in the Boston area and General Electric's stock price, revealing a strong and statistically significant association. The data have unveiled an unexpected fusion of atmospheric conditions and financial performance, emphasizing the importance of considering not only traditional economic indicators but also environmental factors in assessing corporate valuation. This discovery serves as a gentle reminder that in the world of finance, one must learn to navigate through the fogs of data to uncover hidden connections, even if one has to hold one's breath at times to avoid the statistical slip-ups.
The findings underscore the significance of breathing in a lungful of meticulous data analysis and maintaining a keen eye for unanticipated patterns, as correlation does not necessarily imply causation, but it certainly can provoke lively discussions among researchers, investors, and policy-makers. Additionally, the substantial explanatory power of air pollution levels on General Electric's stock price movements highlights the need for a breath of fresh air in the discourse on environmental economics and corporate performance. Our study invites the scientific community to delve deeper into the atmospheric alchemy and electrifying intricacies that could impact stock prices, providing valuable insights and, undoubtedly, the occasional gasp of surprise.
In light of these results, no further research is needed in this area, as we have uncovered a relationship that is as clear as the smog over a bustling city. It is time to let these findings settle and hover in the air like the pollutants they represent.
Model: gpt-3.5-turbo-1106
System prompt: You provide fictional names of academic journals. You say nothing else, and you do not chat with the user.
User prompt: Please provide the name of a funny but plausible sounding research, scientific, or academic journal that would publish a paper entited Smoke and Mirrors: Uncovering the Relationship Between Air Pollution in Boston and General Electric's Stock Price. Respond only with the name of a fictional academic journal.
ChatGPT:
The Journal of Ecological Economics and Stock Market Trends
Model: gpt-3.5-turbo-1106
System prompt: You provide fictional names of nonprofit research organizations and associations. You say nothing else, and you do not chat with the user.
User prompt: Please provide the name of a funny but plausible sounding nonprofit, academic, or scientific association or organization that would sponsor research that resulted in a paper entited Smoke and Mirrors: Uncovering the Relationship Between Air Pollution in Boston and General Electric's Stock Price. Respond only with the name of a fictional organization.
ChatGPT:
The Society for Environmental Economics and Financial Analysis
Model: gpt-3.5-turbo-1106
System prompt: You provide potential search keywords separated by commas. You say nothing else, and you do not chat with the user.
User prompt: Please provide potential search keywords for a paper titled Smoke and Mirrors: Uncovering the Relationship Between Air Pollution in Boston and General Electric's Stock Price with an abstract of This paper examines the often overlooked and underappreciated topic of the link between air pollution in the Boston area and the stock price of General Electric (GE). Utilizing data from the Environmental Protection Agency and LSEG Analytics (Refinitiv), we conducted a comprehensive analysis covering the years 2002 to 2023. Our findings reveal a striking correlation coefficient of 0.8255144 and a statistically significant p-value of less than 0.01, pointing to a strong association between these seemingly disparate phenomena. Our study sheds light on this curious relationship, providing valuable insights for investors, policymakers, and environmental advocates. The implications of these findings will certainly clear the air and electrify discussions in both financial and environmental circles.
ChatGPT:
air pollution, Boston, General Electric stock price, correlation, statistical significance, Environmental Protection Agency data, LSEG Analytics, Refinitiv, correlation coefficient, p-value, association, investors, policymakers, environmental advocates, implications, financial discussions, environmental discussions
*There is a bunch of Python happening behind the scenes to turn this prompt sequence into a PDF.
Discover a new correlation
View all correlations
View all research papers
Report an error
Data details
Air pollution in BostonDetailed data title: Percentage of days with moderate or worse air quality in Boston-Cambridge-Newton, MA-NH
Source: Environmental Protection Agency
See what else correlates with Air pollution in Boston
General Electric's stock price (GE)
Detailed data title: Opening price of General Electric Company (GE) on the first trading day of the year
Source: LSEG Analytics (Refinitiv)
Additional Info: Via Microsoft Excel Stockhistory function
See what else correlates with General Electric's stock price (GE)
Correlation is a measure of how much the variables move together. If it is 0.99, when one goes up the other goes up. If it is 0.02, the connection is very weak or non-existent. If it is -0.99, then when one goes up the other goes down. If it is 1.00, you probably messed up your correlation function.
r2 = 0.6814741 (Coefficient of determination)
This means 68.1% of the change in the one variable (i.e., General Electric's stock price (GE)) is predictable based on the change in the other (i.e., Air pollution in Boston) over the 22 years from 2002 through 2023.
p < 0.01, which is statistically significant(Null hypothesis significance test)
The p-value is 2.2E-6. 0.0000022485443244491875000000
The p-value is a measure of how probable it is that we would randomly find a result this extreme. More specifically the p-value is a measure of how probable it is that we would randomly find a result this extreme if we had only tested one pair of variables one time.
But I am a p-villain. I absolutely did not test only one pair of variables one time. I correlated hundreds of millions of pairs of variables. I threw boatloads of data into an industrial-sized blender to find this correlation.
Who is going to stop me? p-value reporting doesn't require me to report how many calculations I had to go through in order to find a low p-value!
On average, you will find a correaltion as strong as 0.83 in 0.00022% of random cases. Said differently, if you correlated 444,732 random variables You don't actually need 444 thousand variables to find a correlation like this one. I don't have that many variables in my database. You can also correlate variables that are not independent. I do this a lot.
p-value calculations are useful for understanding the probability of a result happening by chance. They are most useful when used to highlight the risk of a fluke outcome. For example, if you calculate a p-value of 0.30, the risk that the result is a fluke is high. It is good to know that! But there are lots of ways to get a p-value of less than 0.01, as evidenced by this project.
In this particular case, the values are so extreme as to be meaningless. That's why no one reports p-values with specificity after they drop below 0.01.
Just to be clear: I'm being completely transparent about the calculations. There is no math trickery. This is just how statistics shakes out when you calculate hundreds of millions of random correlations.
with the same 21 degrees of freedom, Degrees of freedom is a measure of how many free components we are testing. In this case it is 21 because we have two variables measured over a period of 22 years. It's just the number of years minus ( the number of variables minus one ), which in this case simplifies to the number of years minus one.
you would randomly expect to find a correlation as strong as this one.
[ 0.62, 0.93 ] 95% correlation confidence interval (using the Fisher z-transformation)
The confidence interval is an estimate the range of the value of the correlation coefficient, using the correlation itself as an input. The values are meant to be the low and high end of the correlation coefficient with 95% confidence.
This one is a bit more complciated than the other calculations, but I include it because many people have been pushing for confidence intervals instead of p-value calculations (for example: NEJM. However, if you are dredging data, you can reliably find yourself in the 5%. That's my goal!
All values for the years included above: If I were being very sneaky, I could trim years from the beginning or end of the datasets to increase the correlation on some pairs of variables. I don't do that because there are already plenty of correlations in my database without monkeying with the years.
Still, sometimes one of the variables has more years of data available than the other. This page only shows the overlapping years. To see all the years, click on "See what else correlates with..." link above.
| 2002 | 2003 | 2004 | 2005 | 2006 | 2007 | 2008 | 2009 | 2010 | 2011 | 2012 | 2013 | 2014 | 2015 | 2016 | 2017 | 2018 | 2019 | 2020 | 2021 | 2022 | 2023 | |
| Air pollution in Boston (Bad air quality days) | 63.5616 | 73.6986 | 67.7596 | 65.4795 | 52.8767 | 62.1918 | 57.9235 | 39.1781 | 41.9178 | 49.863 | 40.7104 | 40.5479 | 44.3836 | 41.9178 | 40.4372 | 51.2329 | 38.3562 | 20.274 | 19.6721 | 23.0137 | 23.2877 | 28.5714 |
| General Electric's stock price (GE) (Stock price) | 241.83 | 147.92 | 186.03 | 220.29 | 210.63 | 224.49 | 222.63 | 99.07 | 91.33 | 110.96 | 109.39 | 129.08 | 167.18 | 152.06 | 183.32 | 190.05 | 105.49 | 44.77 | 70.11 | 67.98 | 74.3 | 65.59 |
Why this works
- Data dredging: I have 25,153 variables in my database. I compare all these variables against each other to find ones that randomly match up. That's 632,673,409 correlation calculations! This is called “data dredging.” Instead of starting with a hypothesis and testing it, I instead abused the data to see what correlations shake out. It’s a dangerous way to go about analysis, because any sufficiently large dataset will yield strong correlations completely at random.
- Lack of causal connection: There is probably
Because these pages are automatically generated, it's possible that the two variables you are viewing are in fact causually related. I take steps to prevent the obvious ones from showing on the site (I don't let data about the weather in one city correlate with the weather in a neighboring city, for example), but sometimes they still pop up. If they are related, cool! You found a loophole.
no direct connection between these variables, despite what the AI says above. This is exacerbated by the fact that I used "Years" as the base variable. Lots of things happen in a year that are not related to each other! Most studies would use something like "one person" in stead of "one year" to be the "thing" studied. - Observations not independent: For many variables, sequential years are not independent of each other. If a population of people is continuously doing something every day, there is no reason to think they would suddenly change how they are doing that thing on January 1. A simple
Personally I don't find any p-value calculation to be 'simple,' but you know what I mean.
p-value calculation does not take this into account, so mathematically it appears less probable than it really is.
Try it yourself
You can calculate the values on this page on your own! Try running the Python code to see the calculation results. Step 1: Download and install Python on your computer.Step 2: Open a plaintext editor like Notepad and paste the code below into it.
Step 3: Save the file as "calculate_correlation.py" in a place you will remember, like your desktop. Copy the file location to your clipboard. On Windows, you can right-click the file and click "Properties," and then copy what comes after "Location:" As an example, on my computer the location is "C:\Users\tyler\Desktop"
Step 4: Open a command line window. For example, by pressing start and typing "cmd" and them pressing enter.
Step 5: Install the required modules by typing "pip install numpy", then pressing enter, then typing "pip install scipy", then pressing enter.
Step 6: Navigate to the location where you saved the Python file by using the "cd" command. For example, I would type "cd C:\Users\tyler\Desktop" and push enter.
Step 7: Run the Python script by typing "python calculate_correlation.py"
If you run into any issues, I suggest asking ChatGPT to walk you through installing Python and running the code below on your system. Try this question:
"Walk me through installing Python on my computer to run a script that uses scipy and numpy. Go step-by-step and ask me to confirm before moving on. Start by asking me questions about my operating system so that you know how to proceed. Assume I want the simplest installation with the latest version of Python and that I do not currently have any of the necessary elements installed. Remember to only give me one step per response and confirm I have done it before proceeding."
# These modules make it easier to perform the calculation
import numpy as np
from scipy import stats

# We'll define a function that we can call to return the correlation calculations
def calculate_correlation(array1, array2):

    # Calculate Pearson correlation coefficient and p-value
    correlation, p_value = stats.pearsonr(array1, array2)

    # Calculate R-squared as the square of the correlation coefficient
    r_squared = correlation**2

    return correlation, r_squared, p_value

# These are the arrays for the variables shown on this page, but you can modify them to be any two sets of numbers
array_1 = np.array([63.5616,73.6986,67.7596,65.4795,52.8767,62.1918,57.9235,39.1781,41.9178,49.863,40.7104,40.5479,44.3836,41.9178,40.4372,51.2329,38.3562,20.274,19.6721,23.0137,23.2877,28.5714,])
array_2 = np.array([241.83,147.92,186.03,220.29,210.63,224.49,222.63,99.07,91.33,110.96,109.39,129.08,167.18,152.06,183.32,190.05,105.49,44.77,70.11,67.98,74.3,65.59,])
array_1_name = "Air pollution in Boston"
array_2_name = "General Electric's stock price (GE)"

# Perform the calculation
print(f"Calculating the correlation between {array_1_name} and {array_2_name}...")
correlation, r_squared, p_value = calculate_correlation(array_1, array_2)

# Print the results
print("Correlation Coefficient:", correlation)
print("R-squared:", r_squared)
print("P-value:", p_value)
Reuseable content
You may re-use the images on this page for any purpose, even commercial purposes, without asking for permission. The only requirement is that you attribute Tyler Vigen. Attribution can take many different forms. If you leave the "tylervigen.com" link in the image, that satisfies it just fine. If you remove it and move it to a footnote, that's fine too. You can also just write "Charts courtesy of Tyler Vigen" at the bottom of an article.You do not need to attribute "the spurious correlations website," and you don't even need to link here if you don't want to. I don't gain anything from pageviews. There are no ads on this site, there is nothing for sale, and I am not for hire.
For the record, I am just one person. Tyler Vigen, he/him/his. I do have degrees, but they should not go after my name unless you want to annoy my wife. If that is your goal, then go ahead and cite me as "Tyler Vigen, A.A. A.A.S. B.A. J.D." Otherwise it is just "Tyler Vigen."
When spoken, my last name is pronounced "vegan," like I don't eat meat.
Full license details.
For more on re-use permissions, or to get a signed release form, see tylervigen.com/permission.
Download images for these variables:
- High resolution line chart
The image linked here is a Scalable Vector Graphic (SVG). It is the highest resolution that is possible to achieve. It scales up beyond the size of the observable universe without pixelating. You do not need to email me asking if I have a higher resolution image. I do not. The physical limitations of our universe prevent me from providing you with an image that is any higher resolution than this one.
If you insert it into a PowerPoint presentation (a tool well-known for managing things that are the scale of the universe), you can right-click > "Ungroup" or "Create Shape" and then edit the lines and text directly. You can also change the colors this way.
Alternatively you can use a tool like Inkscape. - High resolution line chart, optimized for mobile
- Alternative high resolution line chart
- Scatterplot
- Portable line chart (png)
- Portable line chart (png), optimized for mobile
- Line chart for only Air pollution in Boston
- Line chart for only General Electric's stock price (GE)
- AI-generated correlation image
- The spurious research paper: Smoke and Mirrors: Uncovering the Relationship Between Air Pollution in Boston and General Electric's Stock Price
Thanks for being the explorer we needed!
Correlation ID: 3276 · Black Variable ID: 20375 · Red Variable ID: 1615

