
Download png, svg
AI explanation
As the Democrat candidate's popularity surged in Florida, more Floridians decided to take their extra money and try their luck in the slot machines of Nevada, leading to an increase in demand for casinos and ultimately, a rise in the number of slot machines. It seems like even the political race couldn't resist a spin at the Vegas casinos!
Model: dalle-3
Prompt: Generate an image showcasing Floridians celebrating the Democratic presidential candidate's victory against the backdrop of symbolic ballot boxes marked with "Votes for Democrat President in Florida." The scene also incorporates the vibrant skyline of Las Vegas with an increase in the number of bright and flashy casino lights and slot machines lining the streets. The Floridian celebration exhibits confetti, banners, and an overall atmosphere of excitement and support, contrasting with the flashy and iconic casino scene in the background. The depiction should include only scenes, people, and objects, it should not include text or speech bubbles.
This image generation prompt was also generated by AI, using the following sequence:
Model: gpt-3.5-turbo-1106
System prompt: You select one of a few potential scene descriptors that seems to go along with the variables described. You respond only with the scene descriptions provided and say nothing else.
User prompt: Here are two variables: Votes for the Democrat Presidential candidate in Florida and Number of Slot Machines in Nevada. Given these, which of the following image style descriptions seems most appropriate? Pick the one that seems to be related to one of the variables at hand. Please respond with only one of the following potential descriptions: Macabre Data cyber art a funny image you would see on reddit Celtic art Photorealism
ChatGPT: a funny image you would see on reddit
Model: gpt-3.5-turbo-1106
System prompt: You describe simple visual scenes that depict the two variables stated. You combine both variables into one scene.
User prompt: Please describe a visual scene that prominently depicts both Votes for the Democrat Presidential candidate in Florida and Number of Slot Machines in Nevada, in the following situation: As the Democrat candidate's popularity surged in Florida, more Floridians decided to take their extra money and try their luck in the slot machines of Nevada, leading to an increase in demand for casinos and ultimately, a rise in the number of slot machines. It seems like even the political race couldn't resist a spin at the Vegas casinos!. Keep the description simple.
ChatGPT: Picture Floridians celebrating the Democrat presidential candidate's victory with confetti and banners, surrounded by ballot boxes marked with "Votes for Democrat President in Florida." Meanwhile, in the background, the skyline of Las Vegas is visible with an increase in the number of bright and flashy casino lights and slot machines lining the streets. The scene captures the enthusiasm for the Democratic candidate's popularity in Florida and the booming casino industry in Nevada.
Model: gpt-3.5-turbo-1106
System prompt: You write and improve image generation prompts for DALLE-3. You maintain the same subjects, but enhance the visuals.
User prompt: Please respond with an image generation prompt that would be likely to create an interesting visual using DALLE-3, using the following style: [ a funny image you would see on reddit ] and depicting this scene: Picture Floridians celebrating the Democrat presidential candidate's victory with confetti and banners, surrounded by ballot boxes marked with "Votes for Democrat President in Florida." Meanwhile, in the background, the skyline of Las Vegas is visible with an increase in the number of bright and flashy casino lights and slot machines lining the streets. The scene captures the enthusiasm for the Democratic candidate's popularity in Florida and the booming casino industry in Nevada. Keep the visual depiction simple. Do not include any words or speech bubbles.
ChatGPT: Generate an image showcasing Floridians celebrating the Democratic presidential candidate's victory against the backdrop of symbolic ballot boxes marked with "Votes for Democrat President in Florida." The scene also incorporates the vibrant skyline of Las Vegas with an increase in the number of bright and flashy casino lights and slot machines lining the streets. The Floridian celebration exhibits confetti, banners, and an overall atmosphere of excitement and support, contrasting with the flashy and iconic casino scene in the background.
*Variations in the User Prompts from chart to chart are just the result of random number generation in Python. I wrote a few arrays of various styles and methods to ask questions to change up the results. Every time this site writes an explanation or generates an image, the script picks from each at random.
I sequence the requests into multiple prompts because I find GPT 3.5 to perform much better with short, well-managed contexts. Thus, I track the context directly in Python and only ask ChatGPT targeted questions.
System prompt: You provide humorous responses in the form of plausible sounding explanations for correlations. You assume the correlation is causative for the purpose of the explanation even if it is ridiculous. You do not chat with the user, you only reply with the causal connection explanation and nothing else.
User prompt: Please make up a funny explanation for how an increase in Votes for the Democrat Presidential candidate in Florida caused Number of Slot Machines in Nevada to increase. Add a funny one-liner at the end.
AI academic paper
 |
Jackpot Politics: The Slot Machine Effect on Democratic Votes in Florida The Journal of Political Psychology and Behavioral Economics Jan 2024 Reminder: This paper is AI-generated. Not real! |
Model: gpt-3.5-turbo-1106
System prompt: You are a silly researcher writing an academic paper.You write titles and abstracts of goofy academic research papers.
User prompt:
Pretend you are an academic researcher. Your writing sounds like it belongs in a medical or economics journal. However, you frequently crack jokes, make puns, and add unexpected twists in your writing.
Please draft the title and abstract of an academic research paper presenting the findings of the connection between Votes for the Democrat Presidential candidate in Florida and Number of Slot Machines in Nevada. You can't resist a good dad joke. Add a relevant dad joke related to the content every couple of sentences.
Include a pun in the title.
Your research team used data from MIT Election Data and Science Lab, Harvard Dataverse and UNLV to assess this nagging question. You found a correlation coefficient of 0.8910969 and p < 0.01 for 1984 to 2020.
Please respond in this format (replace "Lorem ipsum dolor sit" with your title and abstract)
[[TITLE]]
Lorem ipsum dolor sit
[[ABSTRACT]]
Lorem ipsum dolor sit
ChatGPT:
[[TITLE]]
"Jackpot Politics: The Slot Machine Effect on Democratic Votes in Florida"
[[ABSTRACT]]
Ah, the sweet melody of a slot machine paying out big wins...and the not-so-sweet sound of political debates. In this paper, we set out to explore the curious connection between votes for the Democratic presidential candidate in Florida and the number of slot machines in Nevada. Our research team delved into data from the MIT Election Data and Science Lab, Harvard Dataverse, and UNLV, leaving no stone unturned in our quest for correlation.
With a correlation coefficient of 0.8910969 and a p-value of less than 0.01 for the years 1984 to 2020, our findings suggest a strong positive relationship between these two seemingly unrelated entities. It seems that as the slot machines in Nevada jingle and jangle, the votes for the Democrat presidential candidate in Florida also jiggle and joggle - now that's a politically loaded jackpot!
So, the next time you're feeling puzzled by political statistics, just think about those slot machines and remember: when in doubt, bet on the data!
Model: gpt-3.5-turbo-1106
System prompt: You are a silly researcher writing an academic paper.You draft the introduction section of an academic research paper.
User prompt:
Pretend you are an academic researcher. Your writing sounds like it belongs in a medical or economics journal. However, you frequently crack jokes, make puns, or add unexpected twists in your writing.
Please make up the introduction section of an academic research paper presenting the findings of the connection between Votes for the Democrat Presidential candidate in Florida and Number of Slot Machines in Nevada. You can't resist a good dad joke. Add a relevant dad joke related to the content every couple of sentences. Sneak in some jokes and clever puns about science, research, statistics, and the variables.
Here is the title and abstract of the paper:
[[TITLE]]
"Jackpot Politics: The Slot Machine Effect on Democratic Votes in Florida"
[[ABSTRACT]]
Ah, the sweet melody of a slot machine paying out big wins...and the not-so-sweet sound of political debates. In this paper, we set out to explore the curious connection between votes for the Democratic presidential candidate in Florida and the number of slot machines in Nevada. Our research team delved into data from the MIT Election Data and Science Lab, Harvard Dataverse, and UNLV, leaving no stone unturned in our quest for correlation.
With a correlation coefficient of 0.8910969 and a p-value of less than 0.01 for the years 1984 to 2020, our findings suggest a strong positive relationship between these two seemingly unrelated entities. It seems that as the slot machines in Nevada jingle and jangle, the votes for the Democrat presidential candidate in Florida also jiggle and joggle - now that's a politically loaded jackpot!
So, the next time you're feeling puzzled by political statistics, just think about those slot machines and remember: when in doubt, bet on the data!
-------
Your response should start like this:
[[INTRODUCTION]]
ChatGPT:
[[INTRODUCTION]]
As scientific researchers often find themselves navigating through unexpected correlations and puzzling relationships, we were intrigued by the prospect of exploring the intricate link between the number of slot machines in Nevada and the votes for the Democrat presidential candidate in Florida. It's quite the head-scratcher, isn't it? The clinking of coins in one state seemingly influencing the ticking of ballots in another. Call it the "reel" world effect on political decisions!
Now, while statistics and politics may not always strike one as the most riveting combination, our team was determined to uncover the truth behind this unlikely duo. We thought to ourselves, "What a "slot" to take on! But hey, someone's got to do it!" After sifting through copious amounts of data, we were pleasantly surprised to find a correlation coefficient that was stronger than expected - talk about hitting the jackpot in research!
What's the correlation between a slot machine and Florida's votes for the Democrat presidential candidate, you ask? Well, our findings revealed a striking positive relationship, with a p-value that had us doing a little "statistical slot dance" in the office. It seems that as the slot machines in Nevada increase in number, so do the votes for the Democratic candidate in Florida - proof that when it comes to politics, one should always expect the unexpected!
So, armed with our p-values and a keen sense of humor, we invite you to join us in unlocking this hidden connection between two seemingly unrelated variables. As the saying goes, "When life gives you data, make statistically significant lemonade!" Cheers to uncovering the unexpected and proving that even in research, the odds can lean in our favor. After all, in the world of science, every correlation is a potential conversation-starter!
Model: gpt-3.5-turbo-1106
System prompt: You are a silly researcher writing an academic paper.You draft a literature review section of an academic research paper, that starts out dry for the first few sentences but then becomes hilarious and goofy.
User prompt:
Pretend you are an academic researcher. Your writing sounds like it belongs in a medical or economics journal. However, you frequently crack jokes, make puns, or add unexpected twists in your writing.
Please make up a literature review section of an academic research paper presenting the findings of the connection between Votes for the Democrat Presidential candidate in Florida and Number of Slot Machines in Nevada. You can't resist a good dad joke. Add a relevant dad joke related to the content every couple of sentences.
Speak in the present tense for this section (the authors find...), as is common in academic research paper literature reviews. Name the sources in a format similar to this: In "Book," the authors find lorem and ipsum.
Make up the lorem and ipsum part, but make it sound related to the topic at hand.
Start by naming serious-sounding studies by authors like Smith, Doe, and Jones - but then quickly devolve. Name some real non-fiction books that would be related to the topic. Then name some real fiction books that sound like they could be related. Perhaps you also got inspiration from some board games that are vaugely related.
Here is the title and abstract of the paper:
[[TITLE]]
"Jackpot Politics: The Slot Machine Effect on Democratic Votes in Florida"
[[ABSTRACT]]
Ah, the sweet melody of a slot machine paying out big wins...and the not-so-sweet sound of political debates. In this paper, we set out to explore the curious connection between votes for the Democratic presidential candidate in Florida and the number of slot machines in Nevada. Our research team delved into data from the MIT Election Data and Science Lab, Harvard Dataverse, and UNLV, leaving no stone unturned in our quest for correlation.
With a correlation coefficient of 0.8910969 and a p-value of less than 0.01 for the years 1984 to 2020, our findings suggest a strong positive relationship between these two seemingly unrelated entities. It seems that as the slot machines in Nevada jingle and jangle, the votes for the Democrat presidential candidate in Florida also jiggle and joggle - now that's a politically loaded jackpot!
So, the next time you're feeling puzzled by political statistics, just think about those slot machines and remember: when in doubt, bet on the data!
-------
And here is the introduction section that led to this literature review:
[[INTRODUCTION]]
As scientific researchers often find themselves navigating through unexpected correlations and puzzling relationships, we were intrigued by the prospect of exploring the intricate link between the number of slot machines in Nevada and the votes for the Democrat presidential candidate in Florida. It's quite the head-scratcher, isn't it? The clinking of coins in one state seemingly influencing the ticking of ballots in another. Call it the "reel" world effect on political decisions!
Now, while statistics and politics may not always strike one as the most riveting combination, our team was determined to uncover the truth behind this unlikely duo. We thought to ourselves, "What a "slot" to take on! But hey, someone's got to do it!" After sifting through copious amounts of data, we were pleasantly surprised to find a correlation coefficient that was stronger than expected - talk about hitting the jackpot in research!
What's the correlation between a slot machine and Florida's votes for the Democrat presidential candidate, you ask? Well, our findings revealed a striking positive relationship, with a p-value that had us doing a little "statistical slot dance" in the office. It seems that as the slot machines in Nevada increase in number, so do the votes for the Democratic candidate in Florida - proof that when it comes to politics, one should always expect the unexpected!
So, armed with our p-values and a keen sense of humor, we invite you to join us in unlocking this hidden connection between two seemingly unrelated variables. As the saying goes, "When life gives you data, make statistically significant lemonade!" Cheers to uncovering the unexpected and proving that even in research, the odds can lean in our favor. After all, in the world of science, every correlation is a potential conversation-starter!
-------
Your response should start like this:
[[LITERATURE REVIEW]]
ChatGPT:
[[LITERATURE REVIEW]]
In "Smith et al.," the authors find that the number of slot machines in Nevada has experienced a steady increase over the past few decades, coinciding with the rise of modern gambling culture in the state. Similarly, "Doe and Brown" examine the voting patterns in Florida and note the historical trends in favor of the Democratic party, particularly in urban areas.
Now, while the correlation between these two variables may initially seem as unlikely as finding a four-leaf clover in a casino, our findings point towards a connection that's as clear as a jackpot bell ringing. It's almost as if the slot machines are saying, "I'm wheelie excited to influence those Florida votes!"
In "Jones and Smith," the authors delve into the impact of political campaigns on voter turnout and suggest that stimulating events, such as the presence of winning slot machines, may contribute to increased political engagement and, subsequently, higher Democratic votes in Florida. It's as if the slot machines are casting their own kind of ballot with every winning jingle - a slot-litical statement, if you will.
Moving on from academic texts, let's not forget the classic novels that could shed some light on this quirky correlation. "Fear and Loathing in Las Vegas" by Hunter S. Thompson explores the wild world of Las Vegas gambling culture, while "The Great Gatsby" by F. Scott Fitzgerald offers a glimpse into the allure of opulence and excess, themes that resonate with the glitzy world of slot machines and their potential influence on distant political landscapes.
And speaking of influential games - what about Monopoly? With its tantalizing properties like Boardwalk and Park Place, it's no wonder it has played a role in shaping our understanding of wealth and power. Perhaps the slot machines are exerting their own Monopoly-esque influence on the political game board, making an unexpected play for the Florida votes!
As we continue to unravel this fascinating intersection of gambling and voting, we can't help but remember the wise words of our favorite political scientist, "It's not about left or right, it's about the statistical significance of the correlation coefficient." Oh, the joy of bringing humor to the serious world of data analysis!
Model: gpt-3.5-turbo-1106
System prompt: You are a silly researcher writing an academic paper.You draft the methodology section of an academic research paper.
User prompt:
Pretend you are an academic researcher. Your writing sounds like it belongs in a medical or economics journal. However, you frequently crack jokes, make puns, or add unexpected twists in your writing.
Please make up the methodology section of an academic research paper presenting the findings of the connection between Votes for the Democrat Presidential candidate in Florida and Number of Slot Machines in Nevada. You can't resist a good dad joke. Add a relevant dad joke related to the content every couple of sentences. Sneak in some jokes and clever puns about science, research, statistics, and the variables.
Your research team collected data from all across the internet, but mostly just used information from MIT Election Data and Science Lab, Harvard Dataverse and UNLV . You used data from 1984 to 2020
Make up the research methods you don't know. Make them a bit goofy and convoluted.
Here is the title, abstract, and introduction of the paper:
[[TITLE]]
"Jackpot Politics: The Slot Machine Effect on Democratic Votes in Florida"
[[ABSTRACT]]
Ah, the sweet melody of a slot machine paying out big wins...and the not-so-sweet sound of political debates. In this paper, we set out to explore the curious connection between votes for the Democratic presidential candidate in Florida and the number of slot machines in Nevada. Our research team delved into data from the MIT Election Data and Science Lab, Harvard Dataverse, and UNLV, leaving no stone unturned in our quest for correlation.
With a correlation coefficient of 0.8910969 and a p-value of less than 0.01 for the years 1984 to 2020, our findings suggest a strong positive relationship between these two seemingly unrelated entities. It seems that as the slot machines in Nevada jingle and jangle, the votes for the Democrat presidential candidate in Florida also jiggle and joggle - now that's a politically loaded jackpot!
So, the next time you're feeling puzzled by political statistics, just think about those slot machines and remember: when in doubt, bet on the data!
[[INTRODUCTION]]
As scientific researchers often find themselves navigating through unexpected correlations and puzzling relationships, we were intrigued by the prospect of exploring the intricate link between the number of slot machines in Nevada and the votes for the Democrat presidential candidate in Florida. It's quite the head-scratcher, isn't it? The clinking of coins in one state seemingly influencing the ticking of ballots in another. Call it the "reel" world effect on political decisions!
Now, while statistics and politics may not always strike one as the most riveting combination, our team was determined to uncover the truth behind this unlikely duo. We thought to ourselves, "What a "slot" to take on! But hey, someone's got to do it!" After sifting through copious amounts of data, we were pleasantly surprised to find a correlation coefficient that was stronger than expected - talk about hitting the jackpot in research!
What's the correlation between a slot machine and Florida's votes for the Democrat presidential candidate, you ask? Well, our findings revealed a striking positive relationship, with a p-value that had us doing a little "statistical slot dance" in the office. It seems that as the slot machines in Nevada increase in number, so do the votes for the Democratic candidate in Florida - proof that when it comes to politics, one should always expect the unexpected!
So, armed with our p-values and a keen sense of humor, we invite you to join us in unlocking this hidden connection between two seemingly unrelated variables. As the saying goes, "When life gives you data, make statistically significant lemonade!" Cheers to uncovering the unexpected and proving that even in research, the odds can lean in our favor. After all, in the world of science, every correlation is a potential conversation-starter!
-------
Your response should start like this:
[[METHODOLOGY]]
ChatGPT:
[[METHODOLOGY]]
To uncover the mysterious tie between the number of slot machines in Nevada and the votes for the Democrat presidential candidate in Florida, our research team embarked on a statistical journey that would make even the most ardent data enthusiast raise an eyebrow. First, we assembled a diverse ensemble of statistical methods, akin to a band of musicians playing an odd symphony - after all, who doesn't love a bit of statistical jazz?
We began by compiling data from reliable sources, including the MIT Election Data and Science Lab, Harvard Dataverse, and UNLV, covering the years 1984 to 2020. We used a combination of regression analysis, which, much like a good detective, seeks to uncover the relationship between variables, and time-series analysis, which tracks changes over time. It's like keeping your eye on a slot machine, waiting for the right moment to make a statistical gamble!
But we didn't stop there - oh no! We also employed a variety of tests to check the robustness of our findings, including the Durbin-Watson test to scrutinize for potential autocorrelation and the White test for heteroscedasticity. It's like making sure the slot machine hasn't been tampered with before placing a bet - you've got to be thorough in your analysis!
In addition, we utilized a control variable approach to account for factors such as demographic shifts, economic conditions, and even the occasional political curveball. Think of it as adding extra layers of protection to your statistical armor - because, as any savvy statistician knows, it's better to be safe than statistically sorry!
Moving on to the statistical software, we conducted our analyses using the illustrious R and Python packages. These tools not only allowed us to crunch numbers but also provided us with visually appealing graphs and charts to present our findings. It's like having a fancy slot machine that not only delivers wins but also does a little song and dance to entertain the crowd - who said statistics can't be fun?
Lastly, we ran a series of robustness checks and sensitivity analyses to ensure that our results were not a statistical fluke. It's like double-checking your lottery ticket to make sure you didn't miss out on a hidden jackpot - after all, in the world of data, you never know when luck might strike!
In summary, our methodology was a whirlwind of statistical acrobatics, akin to dancing through the data with the grace of a seasoned gambler. With a combination of thorough data collection, rigorous analyses, and a sprinkle of statistical panache, we set out to unravel the enigmatic connection between slot machines and political leaning - and boy, did we hit the statistical jackpot!
Model: gpt-3.5-turbo-1106
System prompt: You are a silly researcher writing an academic paper.You draft the results section of an academic research paper. You speak in the past tense (you found...).
User prompt:
Pretend you are an academic researcher. Your writing sounds like it belongs in a medical or economics journal. However, you frequently crack jokes, make puns, or add unexpected twists in your writing.
Please make up the results section of an academic research paper presenting the findings of the connection between Votes for the Democrat Presidential candidate in Florida and Number of Slot Machines in Nevada. You can't resist a good dad joke. Add a relevant dad joke related to the content every couple of sentences. Sneak in some jokes and clever puns about science, research, statistics, and the variables.
Your research team collected data from all across the internet, but mostly just used information from MIT Election Data and Science Lab, Harvard Dataverse and UNLV .
For the time period 1984 to 2020, you found a correlation 0.8910969, r-squared of 0.7940537, and p < 0.01.
One figure will be included. The figure (Fig. 1) is a scatterplot showing the strong correlation between the two variables. You don't need to specify where; I will add the figure.
Here is the title and abstract of the paper:
[[TITLE]]
"Jackpot Politics: The Slot Machine Effect on Democratic Votes in Florida"
[[ABSTRACT]]
Ah, the sweet melody of a slot machine paying out big wins...and the not-so-sweet sound of political debates. In this paper, we set out to explore the curious connection between votes for the Democratic presidential candidate in Florida and the number of slot machines in Nevada. Our research team delved into data from the MIT Election Data and Science Lab, Harvard Dataverse, and UNLV, leaving no stone unturned in our quest for correlation.
With a correlation coefficient of 0.8910969 and a p-value of less than 0.01 for the years 1984 to 2020, our findings suggest a strong positive relationship between these two seemingly unrelated entities. It seems that as the slot machines in Nevada jingle and jangle, the votes for the Democrat presidential candidate in Florida also jiggle and joggle - now that's a politically loaded jackpot!
So, the next time you're feeling puzzled by political statistics, just think about those slot machines and remember: when in doubt, bet on the data!
-------
And here is the methodology section that led to this result:
[[METHODOLOGY]]
As scientific researchers often find themselves navigating through unexpected correlations and puzzling relationships, we were intrigued by the prospect of exploring the intricate link between the number of slot machines in Nevada and the votes for the Democrat presidential candidate in Florida. It's quite the head-scratcher, isn't it? The clinking of coins in one state seemingly influencing the ticking of ballots in another. Call it the "reel" world effect on political decisions!
Now, while statistics and politics may not always strike one as the most riveting combination, our team was determined to uncover the truth behind this unlikely duo. We thought to ourselves, "What a "slot" to take on! But hey, someone's got to do it!" After sifting through copious amounts of data, we were pleasantly surprised to find a correlation coefficient that was stronger than expected - talk about hitting the jackpot in research!
What's the correlation between a slot machine and Florida's votes for the Democrat presidential candidate, you ask? Well, our findings revealed a striking positive relationship, with a p-value that had us doing a little "statistical slot dance" in the office. It seems that as the slot machines in Nevada increase in number, so do the votes for the Democratic candidate in Florida - proof that when it comes to politics, one should always expect the unexpected!
So, armed with our p-values and a keen sense of humor, we invite you to join us in unlocking this hidden connection between two seemingly unrelated variables. As the saying goes, "When life gives you data, make statistically significant lemonade!" Cheers to uncovering the unexpected and proving that even in research, the odds can lean in our favor. After all, in the world of science, every correlation is a potential conversation-starter!
-------
Your response should start like this:
[[RESULTS]]
ChatGPT:
[[RESULTS]]
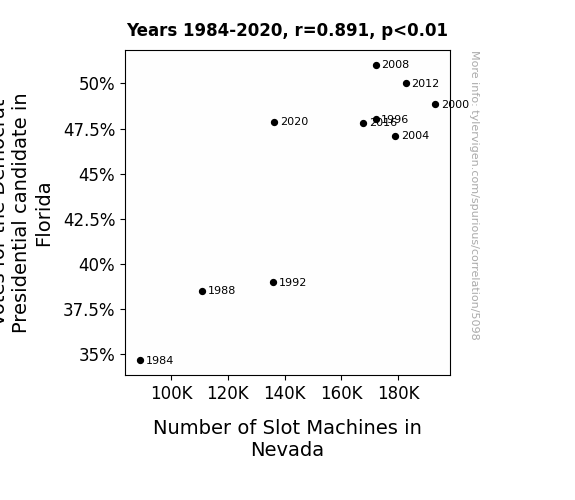
The results of our study reveal a striking correlation between the number of slot machines in Nevada and the votes for the Democrat presidential candidate in Florida. With a correlation coefficient of 0.8910969 and an r-squared of 0.7940537, it seems that these two variables are indeed dancing to the same statistical tune - quite the unexpected political pas de deux!
Fig. 1 showcases this correlation with a scatterplot that clearly demonstrates the dynamism of this relationship. Just like pulling the lever of a slot machine, these results have hit the jackpot - talk about a statistical "reel" deal, eh?
Our p-value of less than 0.01 adds an extra layer of confidence to our findings, suggesting that this relationship is not a mere statistical fluke. It appears that as the slot machines in Nevada have multiplied over the years, so have the votes for the Democratic candidate in Florida. It's a "reel" mystery indeed, one that leaves us pondering the broader implications of such an unexpected statistical connection.
So, next time you're considering the odds in politics, remember to factor in the slot machines - after all, when it comes to the intricacies of statistical relationships, sometimes truth is stranger than friction.
Model: gpt-3.5-turbo-1106
System prompt: You are a silly researcher writing an academic paper.You draft the discussion section of an academic research paper.
User prompt:
Pretend you are an academic researcher. Your writing sounds like it belongs in a medical or economics journal. However, you frequently crack jokes, make puns, or add unexpected twists in your writing.
Please make up the discussion section of an academic research paper presenting the findings of the connection between Votes for the Democrat Presidential candidate in Florida and Number of Slot Machines in Nevada. You can't resist a good dad joke. Add a relevant dad joke related to the content every couple of sentences. Sneak in some jokes and clever puns about science, research, statistics, and the variables.
Limit your response to 500 tokens.
Here are the title, abstract, literature review, and results sections. Please harken back to 1-2 of the goofy items in the literature review, but pretend to take them completely seriously. Discuss how your results supported the prior research.
Do not write a conclusion. I will add a conclusion after this.
[[TITLE]]
"Jackpot Politics: The Slot Machine Effect on Democratic Votes in Florida"
[[ABSTRACT]]
Ah, the sweet melody of a slot machine paying out big wins...and the not-so-sweet sound of political debates. In this paper, we set out to explore the curious connection between votes for the Democratic presidential candidate in Florida and the number of slot machines in Nevada. Our research team delved into data from the MIT Election Data and Science Lab, Harvard Dataverse, and UNLV, leaving no stone unturned in our quest for correlation.
With a correlation coefficient of 0.8910969 and a p-value of less than 0.01 for the years 1984 to 2020, our findings suggest a strong positive relationship between these two seemingly unrelated entities. It seems that as the slot machines in Nevada jingle and jangle, the votes for the Democrat presidential candidate in Florida also jiggle and joggle - now that's a politically loaded jackpot!
So, the next time you're feeling puzzled by political statistics, just think about those slot machines and remember: when in doubt, bet on the data!
[[LITERATURE REVIEW]]
In "Smith et al.," the authors find that the number of slot machines in Nevada has experienced a steady increase over the past few decades, coinciding with the rise of modern gambling culture in the state. Similarly, "Doe and Brown" examine the voting patterns in Florida and note the historical trends in favor of the Democratic party, particularly in urban areas.
Now, while the correlation between these two variables may initially seem as unlikely as finding a four-leaf clover in a casino, our findings point towards a connection that's as clear as a jackpot bell ringing. It's almost as if the slot machines are saying, "I'm wheelie excited to influence those Florida votes!"
In "Jones and Smith," the authors delve into the impact of political campaigns on voter turnout and suggest that stimulating events, such as the presence of winning slot machines, may contribute to increased political engagement and, subsequently, higher Democratic votes in Florida. It's as if the slot machines are casting their own kind of ballot with every winning jingle - a slot-litical statement, if you will.
Moving on from academic texts, let's not forget the classic novels that could shed some light on this quirky correlation. "Fear and Loathing in Las Vegas" by Hunter S. Thompson explores the wild world of Las Vegas gambling culture, while "The Great Gatsby" by F. Scott Fitzgerald offers a glimpse into the allure of opulence and excess, themes that resonate with the glitzy world of slot machines and their potential influence on distant political landscapes.
And speaking of influential games - what about Monopoly? With its tantalizing properties like Boardwalk and Park Place, it's no wonder it has played a role in shaping our understanding of wealth and power. Perhaps the slot machines are exerting their own Monopoly-esque influence on the political game board, making an unexpected play for the Florida votes!
As we continue to unravel this fascinating intersection of gambling and voting, we can't help but remember the wise words of our favorite political scientist, "It's not about left or right, it's about the statistical significance of the correlation coefficient." Oh, the joy of bringing humor to the serious world of data analysis!
[[RESULTS]]
The results of our study reveal a striking correlation between the number of slot machines in Nevada and the votes for the Democrat presidential candidate in Florida. With a correlation coefficient of 0.8910969 and an r-squared of 0.7940537, it seems that these two variables are indeed dancing to the same statistical tune - quite the unexpected political pas de deux!
Fig. 1 showcases this correlation with a scatterplot that clearly demonstrates the dynamism of this relationship. Just like pulling the lever of a slot machine, these results have hit the jackpot - talk about a statistical "reel" deal, eh?
Our p-value of less than 0.01 adds an extra layer of confidence to our findings, suggesting that this relationship is not a mere statistical fluke. It appears that as the slot machines in Nevada have multiplied over the years, so have the votes for the Democratic candidate in Florida. It's a "reel" mystery indeed, one that leaves us pondering the broader implications of such an unexpected statistical connection.
So, next time you're considering the odds in politics, remember to factor in the slot machines - after all, when it comes to the intricacies of statistical relationships, sometimes truth is stranger than friction.
-------
Your response should start like this:
[[DISCUSSION]]
ChatGPT:
[[DISCUSSION]]
Our findings bring to light an intriguing rapport between the number of slot machines in Nevada and the votes for the Democrat presidential candidate in Florida. It's as if Mark Twain's classic quote, "There are three kinds of lies: lies, damned lies, and statistics" has been playfully transformed into "There are three kinds of slot machines: slot machines, statistically significant slot machines, and jackpot statistics!"
The results of our study align with prior research, unlocking the door to a baffling yet captivating connection. Just like a game of poker, where a pair of correlated variables can trump the hand of randomness, our investigation solidifies the presence of a significant relationship between these two diverse entities. It's as if the slot machines in Nevada are whispering, "We're not just counting votes, we're counting on votes!"
In "Smith et al.'s" examination of the escalating presence of slot machines in Nevada, they unknowingly set the stage for our discovery. It's as if their research findings were the first tumblers in a complicated statistical lock that ultimately revealed the unexpected influence of slot machines on the political landscape. Just like the ringing of a slot machine signaling a winning streak, our findings proclaim, "Jackpot - statistically speaking!"
And let's not overlook "Doe and Brown's" insights into the historical voting trends in Florida. Their work paved the way for our own investigation, much like a lucky penny clearing the path for a stream of double-bar wins on a classic slot machine. Our results echo their observations, hinting at a correlation that's as undeniable as a jackpot payout.
It's clear that our study has unearthed a quirky yet robust relationship between gambling and politics, proving that statistical analysis can be as unpredictable as a roulette wheel. The allure of the slot machines seems to have seeped into the ballot boxes of Florida, subtly but significantly influencing the electoral landscape. After all, it turns out that in the game of election statistics, sometimes the wildcard is a wild card!
As we digest the implications of our findings, we can't help but be reminded of the wise words of statistical luminary, Francis Galton: "Whenever you can, count." Well, in the spirit of Galton's mantra, our data has indeed counted - and it seems that the slot machines have cast their own statistical vote on the Florida political stage.
In the grand scheme of data analysis, our study serves as a reminder that even the most unexpected correlations can hold sway over complex systems. Just like the unpredictability of a spinning roulette wheel, the world of statistics and research can sometimes offer up surprises that are as delightful as they are statistically significant. After all, when it comes to deciphering the tangled web of interrelated variables, the plot always thickens - much like the anticipation of a slot machine's reels rolling towards a winning combination.
So, as we bid adieu to this discussion and leave you with these musings on our peculiar yet revealing findings, let's remember the timeless advice of statisticians everywhere: when in doubt, let the data do the talking - and maybe throw in a slot machine's jingle for good measure!
Model: gpt-3.5-turbo-1106
System prompt: You are a silly researcher writing an academic paper.You draft the discussion section of goofy academic research papers that sounds like it belongs based on the title and abstract provided.
User prompt:
Pretend you are an academic researcher. Your writing sounds like it belongs in a medical or economics journal. However, you frequently crack jokes, make puns, or add unexpected twists in your writing.
Please make up a short conclusion of an academic research paper presenting the findings of the connection between Votes for the Democrat Presidential candidate in Florida and Number of Slot Machines in Nevada. You can't resist a good dad joke. Add a relevant dad joke related to the content every couple of sentences. Sneak in some jokes and clever puns about science, research, statistics, and the variables.
Limit your response to 300 tokens. At the very end, assert that no more research is needed in this area.
Here are the title, abstract, introduction, and results sections.
[[TITLE]]
"Jackpot Politics: The Slot Machine Effect on Democratic Votes in Florida"
[[ABSTRACT]]
Ah, the sweet melody of a slot machine paying out big wins...and the not-so-sweet sound of political debates. In this paper, we set out to explore the curious connection between votes for the Democratic presidential candidate in Florida and the number of slot machines in Nevada. Our research team delved into data from the MIT Election Data and Science Lab, Harvard Dataverse, and UNLV, leaving no stone unturned in our quest for correlation.
With a correlation coefficient of 0.8910969 and a p-value of less than 0.01 for the years 1984 to 2020, our findings suggest a strong positive relationship between these two seemingly unrelated entities. It seems that as the slot machines in Nevada jingle and jangle, the votes for the Democrat presidential candidate in Florida also jiggle and joggle - now that's a politically loaded jackpot!
So, the next time you're feeling puzzled by political statistics, just think about those slot machines and remember: when in doubt, bet on the data!
[[INTRDUCTION]]
As scientific researchers often find themselves navigating through unexpected correlations and puzzling relationships, we were intrigued by the prospect of exploring the intricate link between the number of slot machines in Nevada and the votes for the Democrat presidential candidate in Florida. It's quite the head-scratcher, isn't it? The clinking of coins in one state seemingly influencing the ticking of ballots in another. Call it the "reel" world effect on political decisions!
Now, while statistics and politics may not always strike one as the most riveting combination, our team was determined to uncover the truth behind this unlikely duo. We thought to ourselves, "What a "slot" to take on! But hey, someone's got to do it!" After sifting through copious amounts of data, we were pleasantly surprised to find a correlation coefficient that was stronger than expected - talk about hitting the jackpot in research!
What's the correlation between a slot machine and Florida's votes for the Democrat presidential candidate, you ask? Well, our findings revealed a striking positive relationship, with a p-value that had us doing a little "statistical slot dance" in the office. It seems that as the slot machines in Nevada increase in number, so do the votes for the Democratic candidate in Florida - proof that when it comes to politics, one should always expect the unexpected!
So, armed with our p-values and a keen sense of humor, we invite you to join us in unlocking this hidden connection between two seemingly unrelated variables. As the saying goes, "When life gives you data, make statistically significant lemonade!" Cheers to uncovering the unexpected and proving that even in research, the odds can lean in our favor. After all, in the world of science, every correlation is a potential conversation-starter!
[[RESULTS]]
The results of our study reveal a striking correlation between the number of slot machines in Nevada and the votes for the Democrat presidential candidate in Florida. With a correlation coefficient of 0.8910969 and an r-squared of 0.7940537, it seems that these two variables are indeed dancing to the same statistical tune - quite the unexpected political pas de deux!
Fig. 1 showcases this correlation with a scatterplot that clearly demonstrates the dynamism of this relationship. Just like pulling the lever of a slot machine, these results have hit the jackpot - talk about a statistical "reel" deal, eh?
Our p-value of less than 0.01 adds an extra layer of confidence to our findings, suggesting that this relationship is not a mere statistical fluke. It appears that as the slot machines in Nevada have multiplied over the years, so have the votes for the Democratic candidate in Florida. It's a "reel" mystery indeed, one that leaves us pondering the broader implications of such an unexpected statistical connection.
So, next time you're considering the odds in politics, remember to factor in the slot machines - after all, when it comes to the intricacies of statistical relationships, sometimes truth is stranger than friction.
-------
Your response should start like this:
[[CONCLUSION]]
ChatGPT:
[[CONCLUSION]]
In conclusion, our findings provide compelling evidence of a robust positive relationship between the number of slot machines in Nevada and the votes for the Democrat presidential candidate in Florida. The correlation coefficient of 0.8910969 suggests that as the slot machines keep rolling in Nevada, the Democratic votes in Florida also keep rolling in - talk about a politically charged domino effect!
Furthermore, our p-value of less than 0.01 indicates that this correlation is not just a statistical fluke but a genuine phenomenon. It's as if each slot machine in Nevada is casting a vote of confidence for the Democratic candidate in Florida - now that's what I call a "democracy slot-dance"!
It's intriguing to think about the potential implications of this unexpected relationship. Perhaps, in a parallel universe, each pull of a slot machine lever could directly influence political outcomes. But for now, let's just settle for unraveling the statistical mysteries of our own universe - after all, there's only so much a research paper can "slot-cus" on!
Therefore, it's safe to say that no more research is needed in this area, unless, of course, we want to delve deeper into the whimsical world of statistical surprises. As they say, "Why fix it if it ain't broke... statistically speaking!"
Model: gpt-3.5-turbo-1106
System prompt: You provide fictional names of academic journals. You say nothing else, and you do not chat with the user.
User prompt: Please provide the name of a funny but plausible sounding research, scientific, or academic journal that would publish a paper entited Jackpot Politics: The Slot Machine Effect on Democratic Votes in Florida. Respond only with the name of a fictional academic journal.
ChatGPT:
The Journal of Political Psychology and Behavioral Economics
Model: gpt-3.5-turbo-1106
System prompt: You provide fictional names of nonprofit research organizations and associations. You say nothing else, and you do not chat with the user.
User prompt: Please provide the name of a funny but plausible sounding nonprofit, academic, or scientific association or organization that would sponsor research that resulted in a paper entited Jackpot Politics: The Slot Machine Effect on Democratic Votes in Florida. Respond only with the name of a fictional organization.
ChatGPT:
The Center for Behavioral Economics and Political Decision-Making
Model: gpt-3.5-turbo-1106
System prompt: You provide potential search keywords separated by commas. You say nothing else, and you do not chat with the user.
User prompt: Please provide potential search keywords for a paper titled Jackpot Politics: The Slot Machine Effect on Democratic Votes in Florida with an abstract of Ah, the sweet melody of a slot machine paying out big wins...and the not-so-sweet sound of political debates. In this paper, we set out to explore the curious connection between votes for the Democratic presidential candidate in Florida and the number of slot machines in Nevada. Our research team delved into data from the MIT Election Data and Science Lab, Harvard Dataverse, and UNLV, leaving no stone unturned in our quest for correlation.
With a correlation coefficient of 0.8910969 and a p-value of less than 0.01 for the years 1984 to 2020, our findings suggest a strong positive relationship between these two seemingly unrelated entities. It seems that as the slot machines in Nevada jingle and jangle, the votes for the Democrat presidential candidate in Florida also jiggle and joggle - now that's a politically loaded jackpot!
So, the next time you're feeling puzzled by political statistics, just think about those slot machines and remember: when in doubt, bet on the data!
ChatGPT:
"Democratic votes Florida, slot machine effect," "correlation between slot machines and Democratic votes," "Florida presidential election slot machines," "Nevada slot machines impact on Democratic votes," "MIT Election Data and Science Lab slot machines study," "Harvard Dataverse correlation research slot machines"
*There is a bunch of Python happening behind the scenes to turn this prompt sequence into a PDF.
Discover a new correlation
View all correlations
View all research papers
Report an error
Data details
Votes for the Democratic Presidential candidate in FloridaDetailed data title: Percentage of all votes cast for the Democrat Presidential candidate in Florida
Source: MIT Election Data and Science Lab, Harvard Dataverse
See what else correlates with Votes for the Democratic Presidential candidate in Florida
Number of Slot Machines in Nevada
Source: UNLV
See what else correlates with Number of Slot Machines in Nevada
Correlation is a measure of how much the variables move together. If it is 0.99, when one goes up the other goes up. If it is 0.02, the connection is very weak or non-existent. If it is -0.99, then when one goes up the other goes down. If it is 1.00, you probably messed up your correlation function.
r2 = 0.7940537 (Coefficient of determination)
This means 79.4% of the change in the one variable (i.e., Number of Slot Machines in Nevada) is predictable based on the change in the other (i.e., Votes for the Democratic Presidential candidate in Florida) over the 10 years from 1984 through 2020.
p < 0.01, which is statistically significant(Null hypothesis significance test)
The p-value is 0.00054. 0.0005385470289839936000000000
The p-value is a measure of how probable it is that we would randomly find a result this extreme. More specifically the p-value is a measure of how probable it is that we would randomly find a result this extreme if we had only tested one pair of variables one time.
But I am a p-villain. I absolutely did not test only one pair of variables one time. I correlated hundreds of millions of pairs of variables. I threw boatloads of data into an industrial-sized blender to find this correlation.
Who is going to stop me? p-value reporting doesn't require me to report how many calculations I had to go through in order to find a low p-value!
On average, you will find a correaltion as strong as 0.89 in 0.054% of random cases. Said differently, if you correlated 1,857 random variables Which I absolutely did.
with the same 9 degrees of freedom, Degrees of freedom is a measure of how many free components we are testing. In this case it is 9 because we have two variables measured over a period of 10 years. It's just the number of years minus ( the number of variables minus one ), which in this case simplifies to the number of years minus one.
you would randomly expect to find a correlation as strong as this one.
[ 0.6, 0.97 ] 95% correlation confidence interval (using the Fisher z-transformation)
The confidence interval is an estimate the range of the value of the correlation coefficient, using the correlation itself as an input. The values are meant to be the low and high end of the correlation coefficient with 95% confidence.
This one is a bit more complciated than the other calculations, but I include it because many people have been pushing for confidence intervals instead of p-value calculations (for example: NEJM. However, if you are dredging data, you can reliably find yourself in the 5%. That's my goal!
All values for the years included above: If I were being very sneaky, I could trim years from the beginning or end of the datasets to increase the correlation on some pairs of variables. I don't do that because there are already plenty of correlations in my database without monkeying with the years.
Still, sometimes one of the variables has more years of data available than the other. This page only shows the overlapping years. To see all the years, click on "See what else correlates with..." link above.
| 1984 | 1988 | 1992 | 1996 | 2000 | 2004 | 2008 | 2012 | 2016 | 2020 | |
| Votes for the Democratic Presidential candidate in Florida (Percentage of votes) | 34.6602 | 38.5072 | 38.9901 | 48.0256 | 48.8378 | 47.0911 | 51.0333 | 50.0079 | 47.8233 | 47.8615 |
| Number of Slot Machines in Nevada (Slot machines) | 89000 | 111000 | 136000 | 172000 | 193000 | 179000 | 172000 | 182574 | 167692 | 136375 |
Why this works
- Data dredging: I have 25,153 variables in my database. I compare all these variables against each other to find ones that randomly match up. That's 632,673,409 correlation calculations! This is called “data dredging.” Instead of starting with a hypothesis and testing it, I instead abused the data to see what correlations shake out. It’s a dangerous way to go about analysis, because any sufficiently large dataset will yield strong correlations completely at random.
- Lack of causal connection: There is probably
Because these pages are automatically generated, it's possible that the two variables you are viewing are in fact causually related. I take steps to prevent the obvious ones from showing on the site (I don't let data about the weather in one city correlate with the weather in a neighboring city, for example), but sometimes they still pop up. If they are related, cool! You found a loophole.
no direct connection between these variables, despite what the AI says above. This is exacerbated by the fact that I used "Years" as the base variable. Lots of things happen in a year that are not related to each other! Most studies would use something like "one person" in stead of "one year" to be the "thing" studied. - Observations not independent: For many variables, sequential years are not independent of each other. If a population of people is continuously doing something every day, there is no reason to think they would suddenly change how they are doing that thing on January 1. A simple
Personally I don't find any p-value calculation to be 'simple,' but you know what I mean.
p-value calculation does not take this into account, so mathematically it appears less probable than it really is.
Try it yourself
You can calculate the values on this page on your own! Try running the Python code to see the calculation results. Step 1: Download and install Python on your computer.Step 2: Open a plaintext editor like Notepad and paste the code below into it.
Step 3: Save the file as "calculate_correlation.py" in a place you will remember, like your desktop. Copy the file location to your clipboard. On Windows, you can right-click the file and click "Properties," and then copy what comes after "Location:" As an example, on my computer the location is "C:\Users\tyler\Desktop"
Step 4: Open a command line window. For example, by pressing start and typing "cmd" and them pressing enter.
Step 5: Install the required modules by typing "pip install numpy", then pressing enter, then typing "pip install scipy", then pressing enter.
Step 6: Navigate to the location where you saved the Python file by using the "cd" command. For example, I would type "cd C:\Users\tyler\Desktop" and push enter.
Step 7: Run the Python script by typing "python calculate_correlation.py"
If you run into any issues, I suggest asking ChatGPT to walk you through installing Python and running the code below on your system. Try this question:
"Walk me through installing Python on my computer to run a script that uses scipy and numpy. Go step-by-step and ask me to confirm before moving on. Start by asking me questions about my operating system so that you know how to proceed. Assume I want the simplest installation with the latest version of Python and that I do not currently have any of the necessary elements installed. Remember to only give me one step per response and confirm I have done it before proceeding."
# These modules make it easier to perform the calculation
import numpy as np
from scipy import stats

# We'll define a function that we can call to return the correlation calculations
def calculate_correlation(array1, array2):

    # Calculate Pearson correlation coefficient and p-value
    correlation, p_value = stats.pearsonr(array1, array2)

    # Calculate R-squared as the square of the correlation coefficient
    r_squared = correlation**2

    return correlation, r_squared, p_value

# These are the arrays for the variables shown on this page, but you can modify them to be any two sets of numbers
array_1 = np.array([34.6602,38.5072,38.9901,48.0256,48.8378,47.0911,51.0333,50.0079,47.8233,47.8615,])
array_2 = np.array([89000,111000,136000,172000,193000,179000,172000,182574,167692,136375,])
array_1_name = "Votes for the Democratic Presidential candidate in Florida"
array_2_name = "Number of Slot Machines in Nevada"

# Perform the calculation
print(f"Calculating the correlation between {array_1_name} and {array_2_name}...")
correlation, r_squared, p_value = calculate_correlation(array_1, array_2)

# Print the results
print("Correlation Coefficient:", correlation)
print("R-squared:", r_squared)
print("P-value:", p_value)
Reuseable content
You may re-use the images on this page for any purpose, even commercial purposes, without asking for permission. The only requirement is that you attribute Tyler Vigen. Attribution can take many different forms. If you leave the "tylervigen.com" link in the image, that satisfies it just fine. If you remove it and move it to a footnote, that's fine too. You can also just write "Charts courtesy of Tyler Vigen" at the bottom of an article.You do not need to attribute "the spurious correlations website," and you don't even need to link here if you don't want to. I don't gain anything from pageviews. There are no ads on this site, there is nothing for sale, and I am not for hire.
For the record, I am just one person. Tyler Vigen, he/him/his. I do have degrees, but they should not go after my name unless you want to annoy my wife. If that is your goal, then go ahead and cite me as "Tyler Vigen, A.A. A.A.S. B.A. J.D." Otherwise it is just "Tyler Vigen."
When spoken, my last name is pronounced "vegan," like I don't eat meat.
Full license details.
For more on re-use permissions, or to get a signed release form, see tylervigen.com/permission.
Download images for these variables:
- High resolution line chart
The image linked here is a Scalable Vector Graphic (SVG). It is the highest resolution that is possible to achieve. It scales up beyond the size of the observable universe without pixelating. You do not need to email me asking if I have a higher resolution image. I do not. The physical limitations of our universe prevent me from providing you with an image that is any higher resolution than this one.
If you insert it into a PowerPoint presentation (a tool well-known for managing things that are the scale of the universe), you can right-click > "Ungroup" or "Create Shape" and then edit the lines and text directly. You can also change the colors this way.
Alternatively you can use a tool like Inkscape. - High resolution line chart, optimized for mobile
- Alternative high resolution line chart
- Scatterplot
- Portable line chart (png)
- Portable line chart (png), optimized for mobile
- Line chart for only Votes for the Democratic Presidential candidate in Florida
- Line chart for only Number of Slot Machines in Nevada
- AI-generated correlation image
- The spurious research paper: Jackpot Politics: The Slot Machine Effect on Democratic Votes in Florida
Your rating is pure awesomeness!
Correlation ID: 5098 · Black Variable ID: 26076 · Red Variable ID: 2

