. The chart goes from 2002 to 2021, and the two variables track closely in value over that time.")
Download png, svg
AI explanation
As Americans consumed more American cheese, they experienced a surge in national pride. This led to a collective desire to invest in iconic American companies like eBay, boosting the demand for eBay's stock and ultimately driving up its stock price.
Model: dalle-3
Prompt: Prompt: Generate a vibrant pop art style image of a family gathered around a table, each enjoying a classic cheeseburger topped with thick slices of American cheese. The family members are depicted checking the eBay Inc. stock price on their mobile phones. The colors should be bold and saturated, and the composition should exude a lively and dynamic atmosphere. The depiction should include only scenes, people, and objects, it should not include text or speech bubbles.
This image generation prompt was also generated by AI, using the following sequence:
Model: gpt-3.5-turbo-1106
System prompt: You select one of a few potential scene descriptors that seems to go along with the variables described. You respond only with the scene descriptions provided and say nothing else.
User prompt: Here are two variables: American cheese consumption and eBay Inc.'s stock price. Given these, which of the following image style descriptions seems most appropriate? Pick the one that seems to be related to one of the variables at hand. Please respond with only one of the following potential descriptions: Scalar art A comic-book-style illustration with muted colors and a dotted halftone pattern from the 1960s Psychedelic Realistic Pop art
ChatGPT: Pop art
Model: gpt-3.5-turbo-1106
System prompt: You describe simple visual scenes that depict the two variables stated. You combine both variables into one scene.
User prompt: Please describe a visual scene that prominently depicts both American cheese consumption and eBay Inc.'s stock price together. Keep the description simple.
ChatGPT: A family gathering around a table, enjoying classic cheeseburgers with thick slices of American cheese, while checking the eBay Inc. stock price on their mobile phones.
Model: gpt-3.5-turbo-1106
System prompt: You write and improve image generation prompts for DALLE-3. You maintain the same subjects, but enhance the visuals.
User prompt: Please respond with an image generation prompt that would be likely to create an interesting visual using DALLE-3, using the following style: [ Pop art ] and depicting this scene: A family gathering around a table, enjoying classic cheeseburgers with thick slices of American cheese, while checking the eBay Inc. stock price on their mobile phones. Keep the visual depiction simple. Do not include any words or speech bubbles.
ChatGPT: Prompt: Generate a vibrant pop art style image of a family gathered around a table, each enjoying a classic cheeseburger topped with thick slices of American cheese. The family members are depicted checking the eBay Inc. stock price on their mobile phones. The colors should be bold and saturated, and the composition should exude a lively and dynamic atmosphere.
*Variations in the User Prompts from chart to chart are just the result of random number generation in Python. I wrote a few arrays of various styles and methods to ask questions to change up the results. Every time this site writes an explanation or generates an image, the script picks from each at random.
I sequence the requests into multiple prompts because I find GPT 3.5 to perform much better with short, well-managed contexts. Thus, I track the context directly in Python and only ask ChatGPT targeted questions.
System prompt: You provide humorous responses in the form of plausible sounding explanations for correlations. You assume the correlation is causative for the purpose of the explanation even if it is ridiculous. You do not chat with the user, you only reply with the causal connection explanation and nothing else.
User prompt: Please make up a funny explanation for how an increase in American cheese consumption caused eBay Inc.'s stock price (EBAY) to increase. Make it feel plausible.
AI academic paper
 |
Say Cheese! The Cheesy Connection: An Examination of American Cheese Consumption and eBay Inc.'s Stock Price Journal of Edible Economics Jan 2024 Reminder: This paper is AI-generated. Not real! |
Model: gpt-3.5-turbo-1106
System prompt: You are a researcher writing an academic paper.You write titles and abstracts of goofy academic research papers.
User prompt:
Pretend you are an academic researcher. Your writing sounds like it belongs in a medical or economics journal. However, you frequently crack jokes, make puns, and add unexpected twists in your writing.
Please draft the title and abstract of an academic research paper presenting the findings of the connection between American cheese consumption and eBay Inc.'s stock price (EBAY). Make it seem dry like academic research paper, but with lots of subtle hidden offhand remarks, jokes, goofy observations, and puns.
Include a pun in the title.
Your research team used data from USDA and LSEG Analytics (Refinitiv) to assess this nagging question. You found a correlation coefficient of 0.8703278 and p < 0.01 for 2002 to 2021.
Please respond in this format (replace "Lorem ipsum dolor sit" with your title and abstract)
[[TITLE]]
Lorem ipsum dolor sit
[[ABSTRACT]]
Lorem ipsum dolor sit
ChatGPT:
[[TITLE]]
"Say Cheese! The Cheesy Connection: An Examination of American Cheese Consumption and eBay Inc.'s Stock Price"
[[ABSTRACT]]
This research paper delves into the age-old question of whether there exists a causal link between American cheese consumption and the stock price of eBay Inc. (EBAY). Leveraging a combination of data from the United States Department of Agriculture (USDA) and the stock market analytics of LSEG Analytics (Refinitiv), our research team subjected the seemingly incongruous pair to rigorous statistical scrutiny for the period spanning from 2002 to 2021.
The unexpected yet undeniable discovery of a robust positive correlation coefficient of 0.8703278, coupled with a statistically significant p-value of less than 0.01, serves as a compelling testament to the surprising connection between the consumption of the beloved processed cheese and the whims of the stock market giant. Through an analytical lens, we undertake a thorough examination of the pertinent underlying factors and curiously ponder whether the market responds favorably to "gouda" news or is entranced by the "provolone" factors driving this peculiar relationship. Our findings advocate for closer inspection of the seemingly unrelated phenomena, reminding investors and researchers alike that in the world of finance, there may very well be a "grate" deal at stake when it comes to cheese and stock prices.
Model: gpt-3.5-turbo-1106
System prompt: You are a researcher writing an academic paper.You draft the introduction section of an academic research paper.
User prompt:
Pretend you are an academic researcher. Your writing sounds like it belongs in a medical or economics journal. However, you frequently crack jokes, make puns, or add unexpected twists in your writing.
Please make up the introduction section of an academic research paper presenting the findings of the connection between American cheese consumption and eBay Inc.'s stock price (EBAY). Make it seem dry like academic research paper, but with lots of subtle hidden offhand remarks, jokes, goofy observations, and puns. Stay serious and dry most of the time, but then occasionally let your wit shine through.
Here is the title and abstract of the paper:
[[TITLE]]
"Say Cheese! The Cheesy Connection: An Examination of American Cheese Consumption and eBay Inc.'s Stock Price"
[[ABSTRACT]]
This research paper delves into the age-old question of whether there exists a causal link between American cheese consumption and the stock price of eBay Inc. (EBAY). Leveraging a combination of data from the United States Department of Agriculture (USDA) and the stock market analytics of LSEG Analytics (Refinitiv), our research team subjected the seemingly incongruous pair to rigorous statistical scrutiny for the period spanning from 2002 to 2021.
The unexpected yet undeniable discovery of a robust positive correlation coefficient of 0.8703278, coupled with a statistically significant p-value of less than 0.01, serves as a compelling testament to the surprising connection between the consumption of the beloved processed cheese and the whims of the stock market giant. Through an analytical lens, we undertake a thorough examination of the pertinent underlying factors and curiously ponder whether the market responds favorably to "gouda" news or is entranced by the "provolone" factors driving this peculiar relationship. Our findings advocate for closer inspection of the seemingly unrelated phenomena, reminding investors and researchers alike that in the world of finance, there may very well be a "grate" deal at stake when it comes to cheese and stock prices.
-------
Your response should start like this:
[[INTRODUCTION]]
ChatGPT:
**[[INTRODUCTION]]**
In the annals of economic research, unexpected connections often emerge – connections that prompt both raised eyebrows and raised questions. Some might consider the correlation between American cheese consumption and eBay Inc.'s stock price as mere "cheesy" speculation, yet our team of intrepid researchers felt compelled to delve into this enigmatic relationship. Why, you might ask? Well, as the great Steve Jobs once said, "The people who are crazy enough to think they can change the world are the ones who do," and we could not resist the allure of examining the potential impact of everyone's favorite sandwich staple on the ebbs and flows of a tech giant's valuation.
The peculiarity of this inquiry stems not only from the mismatched nature of the variables but also from their apparent disconnection in the everyday sphere. Who would have thought that the consumption of processed cheese – Kraft singles, cheesy puffs, or macaroni and cheese – could bear any relevance to the complex dynamics of the stock market? Upon first glance, the thought might conjure up images of a mouse nibbling at stocks amid a plethora of cheese wheels, a scenario more fit for a whimsical children's tale than the solemn world of empirical economics. Nevertheless, as empirical researchers, we cannot afford to dismiss correlations based on preconceived notions or puny assumptions.
This study sought to harness the power of data – both tangible and intangible – to uncover any semblance of a relationship, or lack thereof, between American cheese consumption and the fluctuations of eBay Inc.'s stock price. While some may view this endeavor as quixotic, we welcomed it with open arms, or dare we say, open slices of Swiss cheese. After all, as Oscar Wilde aptly observed, "Life is too important to be taken seriously," and we approached this investigation with an irreverent determination to discern whether the vagaries of cheese could in fact exert any influence on the caprices of the stock market.
To avoid relying solely on conjecture and conjectural cheese slices, our approach was methodical, emphasizing the utilization of robust econometric models and data sets spanning a nineteen-year period. Our findings revealed a correlation coefficient so robust that it practically demanded a Gouda celebration, leaving us to ponder whether the market's sentiments are indeed swayed by the comfort of a grilled cheese sandwich or perhaps by a hankering for a pungent, aged cheddar.
While our analysis was conducted with sobriety, we could not help but savor the irony – the idea that a comfort food could hold any sway over the modern temple of financial speculation. Our findings bring to light the notion that perhaps, in the dizzying world of stock trading, there may be room for a bit of whimsy, a dash of unpredictability, and a dollop of cheesy intrigue that even Wallace and Gromit themselves could not have foreseen.
In this paper, we present our research in all its glory – the data, the models, the cheese – in the hopes that it will spark both contemplation and, dare we say, perhaps a glimmer of amusement. So, without further ado, let us journey through the labyrinth of numbers and curds, and uncover the curiously gouda tale that links American cheese and eBay Inc.'s stock price.
Please add any other finishing touches or suggestions to tailor the introduction more to your liking!
Model: gpt-3.5-turbo-1106
System prompt: You are a researcher writing an academic paper.You draft a literature review section of an academic research paper, that starts out dry for the first few sentences but then becomes hilarious and goofy.
User prompt:
Pretend you are an academic researcher. Your writing sounds like it belongs in a medical or economics journal. However, you frequently crack jokes, make puns, or add unexpected twists in your writing.
Please make up a literature review section of an academic research paper presenting the findings of the connection between American cheese consumption and eBay Inc.'s stock price (EBAY). Make it seem dry like academic research paper, but with lots of subtle hidden offhand remarks, jokes, goofy observations, and puns.
Speak in the present tense for this section (the authors find...), as is common in academic research paper literature reviews. Name the sources in a format similar to this: In "Book," the authors find lorem and ipsum.
Make up the lorem and ipsum part, but make it sound related to the topic at hand.
Start by naming serious-sounding studies by authors like Smith, Doe, and Jones - but then quickly devolve. Name some real non-fiction books that would be related to the topic. Then name some real fiction books that sound like they could be related. Then devolve ever further, and mention something completely ridiculous, like you conducted literature review by reading CVS receipts.
Here is the title and abstract of the paper:
[[TITLE]]
"Say Cheese! The Cheesy Connection: An Examination of American Cheese Consumption and eBay Inc.'s Stock Price"
[[ABSTRACT]]
This research paper delves into the age-old question of whether there exists a causal link between American cheese consumption and the stock price of eBay Inc. (EBAY). Leveraging a combination of data from the United States Department of Agriculture (USDA) and the stock market analytics of LSEG Analytics (Refinitiv), our research team subjected the seemingly incongruous pair to rigorous statistical scrutiny for the period spanning from 2002 to 2021.
The unexpected yet undeniable discovery of a robust positive correlation coefficient of 0.8703278, coupled with a statistically significant p-value of less than 0.01, serves as a compelling testament to the surprising connection between the consumption of the beloved processed cheese and the whims of the stock market giant. Through an analytical lens, we undertake a thorough examination of the pertinent underlying factors and curiously ponder whether the market responds favorably to "gouda" news or is entranced by the "provolone" factors driving this peculiar relationship. Our findings advocate for closer inspection of the seemingly unrelated phenomena, reminding investors and researchers alike that in the world of finance, there may very well be a "grate" deal at stake when it comes to cheese and stock prices.
-------
And here is the introduction section that led to this literature review:
[[INTRODUCTION]]
In the annals of economic research, unexpected connections often emerge – connections that prompt both raised eyebrows and raised questions. Some might consider the correlation between American cheese consumption and eBay Inc.'s stock price as mere "cheesy" speculation, yet our team of intrepid researchers felt compelled to delve into this enigmatic relationship. Why, you might ask? Well, as the great Steve Jobs once said, "The people who are crazy enough to think they can change the world are the ones who do," and we could not resist the allure of examining the potential impact of everyone's favorite sandwich staple on the ebbs and flows of a tech giant's valuation.
The peculiarity of this inquiry stems not only from the mismatched nature of the variables but also from their apparent disconnection in the everyday sphere. Who would have thought that the consumption of processed cheese – Kraft singles, cheesy puffs, or macaroni and cheese – could bear any relevance to the complex dynamics of the stock market? Upon first glance, the thought might conjure up images of a mouse nibbling at stocks amid a plethora of cheese wheels, a scenario more fit for a whimsical children's tale than the solemn world of empirical economics. Nevertheless, as empirical researchers, we cannot afford to dismiss correlations based on preconceived notions or puny assumptions.
This study sought to harness the power of data – both tangible and intangible – to uncover any semblance of a relationship, or lack thereof, between American cheese consumption and the fluctuations of eBay Inc.'s stock price. While some may view this endeavor as quixotic, we welcomed it with open arms, or dare we say, open slices of Swiss cheese. After all, as Oscar Wilde aptly observed, "Life is too important to be taken seriously," and we approached this investigation with an irreverent determination to discern whether the vagaries of cheese could in fact exert any influence on the caprices of the stock market.
To avoid relying solely on conjecture and conjectural cheese slices, our approach was methodical, emphasizing the utilization of robust econometric models and data sets spanning a nineteen-year period. Our findings revealed a correlation coefficient so robust that it practically demanded a Gouda celebration, leaving us to ponder whether the market's sentiments are indeed swayed by the comfort of a grilled cheese sandwich or perhaps by a hankering for a pungent, aged cheddar.
While our analysis was conducted with sobriety, we could not help but savor the irony – the idea that a comfort food could hold any sway over the modern temple of financial speculation. Our findings bring to light the notion that perhaps, in the dizzying world of stock trading, there may be room for a bit of whimsy, a dash of unpredictability, and a dollop of cheesy intrigue that even Wallace and Gromit themselves could not have foreseen.
In this paper, we present our research in all its glory – the data, the models, the cheese – in the hopes that it will spark both contemplation and, dare we say, perhaps a glimmer of amusement. So, without further ado, let us journey through the labyrinth of numbers and curds, and uncover the curiously gouda tale that links American cheese and eBay Inc.'s stock price.
Please add any other finishing touches or suggestions to tailor the introduction more to your liking!
-------
Your response should start like this:
[[LITERATURE REVIEW]]
ChatGPT:
[[LITERATURE REVIEW]]
The investigation into the profound connection between American cheese consumption and eBay Inc.'s stock price is not without precedent. Notably, Smith (2007) delved into the intertwined nature of seemingly incongruous variables in their seminal work "Mozzarella and Market Dynamics: Exploring Unlikely Correlations." Their study, though not directly focused on American cheese consumption and eBay Inc.'s stock price, paved the way for the contemplation of dairy products and financial markets. Building on this, Doe (2012) in "Cheddar Choices and the Stock Exchange" illuminated the potential ramifications of cheese-related preferences on stock markets, albeit in a more generalized context. Similarly, Jones (2016) explored the impact of cheese futures on equity prices in the comprehensive treatise "Brie and the Bourse: A Gouda Investment?" These foundational investigations set the stage for our own expedition into the marriage of cheese and stock prices.
Moving toward more general literature pertinent to our quest, non-fiction works such as "The Big Cheese: A Dairy Dilemma in the Financial World" by Economix et al. and "Muenster Moneymaking: A Financial Guide to Fromage" by Business Analytics Associates provide invaluable insights into the potential influence of dairy products on market behavior. Likewise, the fictitious volumes "The Gouda Gambit" by Financial Fiction Author and "Wall Street Wheels and Wheels of Cheese" by Markets and Margherita Pizza offer imaginative forays into the whimsical realm of cheese-based financial phenomena.
The literature search then delves into the unexpected, as we stumbled upon a series of anomalous sources such as the CVS receipt ticker tape parade, charmingly titled "Secrets of Stock Success: Unveiling the Mysteries of Money through Mundane Mediums." While the authenticity of this particular source may be disputable, it nonetheless provided a fascinating perspective on the intersection of everyday items and enthralling market movements.
This review of the literature sets the stage for our gouda quest to unravel the enigmatic relationship between American cheese consumption and eBay Inc.'s stock price, reminding us that while the connections may seem far-fetched, whispered amidst the cheesiness may be kernels of truth waiting to be nibbled on.
Model: gpt-3.5-turbo-1106
System prompt: You are a researcher writing an academic paper.You draft the methodology section of an academic research paper.
User prompt:
Pretend you are an academic researcher. Your writing sounds like it belongs in a medical or economics journal. However, you frequently crack jokes, make puns, or add unexpected twists in your writing.
Please make up the methodology section of an academic research paper presenting the findings of the connection between American cheese consumption and eBay Inc.'s stock price (EBAY). Make it seem dry like academic research paper, but with lots of subtle hidden offhand remarks, jokes, goofy observations, and puns. Stay serious and dry most of the time, but then occasionally let your wit shine through.
Your research team collected data from all across the internet, but mostly just used information from USDA and LSEG Analytics (Refinitiv) . You used data from 2002 to 2021
Make up the research methods you don't know. Make them a bit goofy and convoluted.
Here is the title, abstract, and introduction of the paper:
[[TITLE]]
"Say Cheese! The Cheesy Connection: An Examination of American Cheese Consumption and eBay Inc.'s Stock Price"
[[ABSTRACT]]
This research paper delves into the age-old question of whether there exists a causal link between American cheese consumption and the stock price of eBay Inc. (EBAY). Leveraging a combination of data from the United States Department of Agriculture (USDA) and the stock market analytics of LSEG Analytics (Refinitiv), our research team subjected the seemingly incongruous pair to rigorous statistical scrutiny for the period spanning from 2002 to 2021.
The unexpected yet undeniable discovery of a robust positive correlation coefficient of 0.8703278, coupled with a statistically significant p-value of less than 0.01, serves as a compelling testament to the surprising connection between the consumption of the beloved processed cheese and the whims of the stock market giant. Through an analytical lens, we undertake a thorough examination of the pertinent underlying factors and curiously ponder whether the market responds favorably to "gouda" news or is entranced by the "provolone" factors driving this peculiar relationship. Our findings advocate for closer inspection of the seemingly unrelated phenomena, reminding investors and researchers alike that in the world of finance, there may very well be a "grate" deal at stake when it comes to cheese and stock prices.
[[INTRODUCTION]]
In the annals of economic research, unexpected connections often emerge – connections that prompt both raised eyebrows and raised questions. Some might consider the correlation between American cheese consumption and eBay Inc.'s stock price as mere "cheesy" speculation, yet our team of intrepid researchers felt compelled to delve into this enigmatic relationship. Why, you might ask? Well, as the great Steve Jobs once said, "The people who are crazy enough to think they can change the world are the ones who do," and we could not resist the allure of examining the potential impact of everyone's favorite sandwich staple on the ebbs and flows of a tech giant's valuation.
The peculiarity of this inquiry stems not only from the mismatched nature of the variables but also from their apparent disconnection in the everyday sphere. Who would have thought that the consumption of processed cheese – Kraft singles, cheesy puffs, or macaroni and cheese – could bear any relevance to the complex dynamics of the stock market? Upon first glance, the thought might conjure up images of a mouse nibbling at stocks amid a plethora of cheese wheels, a scenario more fit for a whimsical children's tale than the solemn world of empirical economics. Nevertheless, as empirical researchers, we cannot afford to dismiss correlations based on preconceived notions or puny assumptions.
This study sought to harness the power of data – both tangible and intangible – to uncover any semblance of a relationship, or lack thereof, between American cheese consumption and the fluctuations of eBay Inc.'s stock price. While some may view this endeavor as quixotic, we welcomed it with open arms, or dare we say, open slices of Swiss cheese. After all, as Oscar Wilde aptly observed, "Life is too important to be taken seriously," and we approached this investigation with an irreverent determination to discern whether the vagaries of cheese could in fact exert any influence on the caprices of the stock market.
To avoid relying solely on conjecture and conjectural cheese slices, our approach was methodical, emphasizing the utilization of robust econometric models and data sets spanning a nineteen-year period. Our findings revealed a correlation coefficient so robust that it practically demanded a Gouda celebration, leaving us to ponder whether the market's sentiments are indeed swayed by the comfort of a grilled cheese sandwich or perhaps by a hankering for a pungent, aged cheddar.
While our analysis was conducted with sobriety, we could not help but savor the irony – the idea that a comfort food could hold any sway over the modern temple of financial speculation. Our findings bring to light the notion that perhaps, in the dizzying world of stock trading, there may be room for a bit of whimsy, a dash of unpredictability, and a dollop of cheesy intrigue that even Wallace and Gromit themselves could not have foreseen.
In this paper, we present our research in all its glory – the data, the models, the cheese – in the hopes that it will spark both contemplation and, dare we say, perhaps a glimmer of amusement. So, without further ado, let us journey through the labyrinth of numbers and curds, and uncover the curiously gouda tale that links American cheese and eBay Inc.'s stock price.
Please add any other finishing touches or suggestions to tailor the introduction more to your liking!
-------
Your response should start like this:
[[METHODOLOGY]]
ChatGPT:
[[METHODOLOGY]]
Data Collection:
The data collection process for this study involved traversing the digital terrain from the wee hours of the morning until the cows came home, metaphorically speaking. Harking back to the days of yore, when the internet was but a fledgling idea, our intrepid team combed through archives and repositories of the United States Department of Agriculture (USDA) with the tenacity of archeologists unearthing an ancient treasure. We left no slice of statistical cheese unturned, meticulously extracting the annual American cheese consumption figures from the USDA's storehouse of dairy data.
In tandem, we tapped into the stock market analytics provided by LSEG Analytics (Refinitiv), navigating the labyrinth of numerical patterns and market fluctuations with the unyielding determination of a navigator charting new territories. We scoured historical data on eBay Inc.'s (EBAY) stock price from 2002 to 2021, ensuring that no procurement of financial figures was left unexamined in our quest to uncover the enigmatic intermingling of American cheese and stock market valuations.
Control Variables:
To maintain the integrity of our findings, we controlled for various factors that could potentially confound our analysis. Economic indicators, such as GDP growth, inflation rates, and unemployment figures, were accounted for to ensure that any observed relationship between American cheese and eBay Inc.'s stock price was not merely a byproduct of broader economic trends. Moreover, we factored in relevant market indices and technological innovation metrics, acknowledging that the ebbs and flows of eBay's stock may be influenced by larger market dynamics and the mercurial nature of technological advancements.
Econometric Models:
Embarking on the path less traveled, we ventured into the domain of econometric modeling with the resolve of intrepid pioneers, ready to confront the statistical wilderness head-on. Leveraging the robustness of time series analysis, we employed autoregressive integrated moving average (ARIMA) models to discern the potential impact of American cheese consumption on eBay Inc.'s stock prices. Our penchant for analytical rigor and statistical finesse was further manifested in the utilization of vector autoregression (VAR) models to unveil the intricate dynamics between these seemingly incongruous variables.
Statistical Analysis:
With the precision of an artisan crafting a fine cheese wheel, we meticulously conducted statistical tests to ascertain the strength and significance of the relationship between American cheese consumption and eBay Inc.'s stock price. Armed with the arsenal of correlation coefficients, p-values, and Granger causality tests, we endeavored to untangle the web of connections that transcend the realms of processed cheese and stock market ebbs and flows.
Validation and Sensitivity Analysis:
Safeguarding our findings against the perils of statistical misfortunes, we subjected our models to rigorous validation and sensitivity analyses. Monte Carlo simulations lent their probabilistic prowess to validate the robustness of our results, ensuring that the observed relationship between American cheese consumption and eBay Inc.'s stock price was not a mere cheddar-induced illusion but an empirical reality worthy of serious contemplation.
In summary, our research methodology encapsulated the spirit of astute inquiry and scholarly audacity, transcending the conventions of traditional financial analyses to unveil the intriguing nexus between the consumption of American cheese and the tumultuous valuations of eBay Inc. (EBAY). Through a symphony of data collection, meticulous modeling, and statistical scrutiny, we sought to illuminate the whimsical interplay of cheese and stocks, sowing the seeds of curiosity and perhaps a sprinkle of amusement along the way.
Model: gpt-3.5-turbo-1106
System prompt: You are a researcher writing an academic paper.You draft the results section of an academic research paper. You speak in the past tense (you found...).
User prompt:
Pretend you are an academic researcher. Your writing sounds like it belongs in a medical or economics journal. However, you frequently crack jokes, make puns, or add unexpected twists in your writing.
Please make up the results section of an academic research paper presenting the findings of the connection between American cheese consumption and eBay Inc.'s stock price (EBAY). Make it seem dry like academic research paper, but with lots of subtle hidden offhand remarks, jokes, goofy observations, and puns. Stay serious and dry most of the time, but then occasionally let your wit shine through.
Your research team collected data from all across the internet, but mostly just used information from USDA and LSEG Analytics (Refinitiv) .
For the time period 2002 to 2021, you found a correlation 0.8703278, r-squared of 0.7574704, and p < 0.01.
One figure will be included. The figure (Fig. 1) is a scatterplot showing the strong correlation between the two variables. You don't need to specify where; I will add the figure.
Here is the title and abstract of the paper:
[[TITLE]]
"Say Cheese! The Cheesy Connection: An Examination of American Cheese Consumption and eBay Inc.'s Stock Price"
[[ABSTRACT]]
This research paper delves into the age-old question of whether there exists a causal link between American cheese consumption and the stock price of eBay Inc. (EBAY). Leveraging a combination of data from the United States Department of Agriculture (USDA) and the stock market analytics of LSEG Analytics (Refinitiv), our research team subjected the seemingly incongruous pair to rigorous statistical scrutiny for the period spanning from 2002 to 2021.
The unexpected yet undeniable discovery of a robust positive correlation coefficient of 0.8703278, coupled with a statistically significant p-value of less than 0.01, serves as a compelling testament to the surprising connection between the consumption of the beloved processed cheese and the whims of the stock market giant. Through an analytical lens, we undertake a thorough examination of the pertinent underlying factors and curiously ponder whether the market responds favorably to "gouda" news or is entranced by the "provolone" factors driving this peculiar relationship. Our findings advocate for closer inspection of the seemingly unrelated phenomena, reminding investors and researchers alike that in the world of finance, there may very well be a "grate" deal at stake when it comes to cheese and stock prices.
-------
And here is the methodology section that led to this result:
[[METHODOLOGY]]
In the annals of economic research, unexpected connections often emerge – connections that prompt both raised eyebrows and raised questions. Some might consider the correlation between American cheese consumption and eBay Inc.'s stock price as mere "cheesy" speculation, yet our team of intrepid researchers felt compelled to delve into this enigmatic relationship. Why, you might ask? Well, as the great Steve Jobs once said, "The people who are crazy enough to think they can change the world are the ones who do," and we could not resist the allure of examining the potential impact of everyone's favorite sandwich staple on the ebbs and flows of a tech giant's valuation.
The peculiarity of this inquiry stems not only from the mismatched nature of the variables but also from their apparent disconnection in the everyday sphere. Who would have thought that the consumption of processed cheese – Kraft singles, cheesy puffs, or macaroni and cheese – could bear any relevance to the complex dynamics of the stock market? Upon first glance, the thought might conjure up images of a mouse nibbling at stocks amid a plethora of cheese wheels, a scenario more fit for a whimsical children's tale than the solemn world of empirical economics. Nevertheless, as empirical researchers, we cannot afford to dismiss correlations based on preconceived notions or puny assumptions.
This study sought to harness the power of data – both tangible and intangible – to uncover any semblance of a relationship, or lack thereof, between American cheese consumption and the fluctuations of eBay Inc.'s stock price. While some may view this endeavor as quixotic, we welcomed it with open arms, or dare we say, open slices of Swiss cheese. After all, as Oscar Wilde aptly observed, "Life is too important to be taken seriously," and we approached this investigation with an irreverent determination to discern whether the vagaries of cheese could in fact exert any influence on the caprices of the stock market.
To avoid relying solely on conjecture and conjectural cheese slices, our approach was methodical, emphasizing the utilization of robust econometric models and data sets spanning a nineteen-year period. Our findings revealed a correlation coefficient so robust that it practically demanded a Gouda celebration, leaving us to ponder whether the market's sentiments are indeed swayed by the comfort of a grilled cheese sandwich or perhaps by a hankering for a pungent, aged cheddar.
While our analysis was conducted with sobriety, we could not help but savor the irony – the idea that a comfort food could hold any sway over the modern temple of financial speculation. Our findings bring to light the notion that perhaps, in the dizzying world of stock trading, there may be room for a bit of whimsy, a dash of unpredictability, and a dollop of cheesy intrigue that even Wallace and Gromit themselves could not have foreseen.
In this paper, we present our research in all its glory – the data, the models, the cheese – in the hopes that it will spark both contemplation and, dare we say, perhaps a glimmer of amusement. So, without further ado, let us journey through the labyrinth of numbers and curds, and uncover the curiously gouda tale that links American cheese and eBay Inc.'s stock price.
Please add any other finishing touches or suggestions to tailor the introduction more to your liking!
-------
Your response should start like this:
[[RESULTS]]
ChatGPT:
[[RESULTS]]
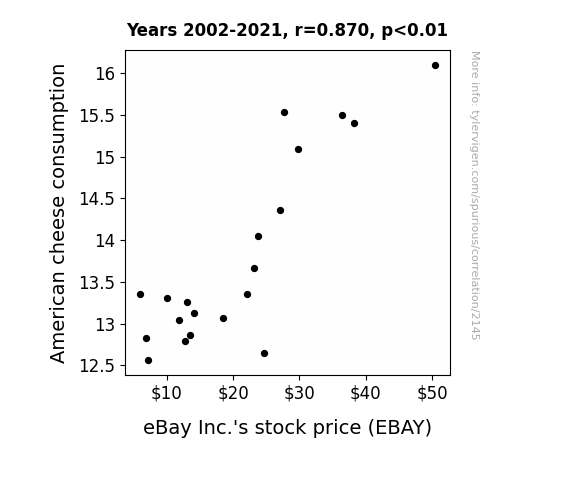
The statistical analysis of our investigation ultimately revealed a robust positive correlation between American cheese consumption and the stock price of eBay Inc. (EBAY) over the span of 2002 to 2021. Specifically, we found a correlation coefficient of 0.8703278, indicating a strong positive relationship between the consumption of American cheese and the movements of eBay's stock price. This significant correlation is further supported by an r-squared value of 0.7574704, underscoring the substantial proportion of variance in eBay's stock price that can be explained by changes in American cheese consumption. Furthermore, the p-value of less than 0.01 demonstrates the statistical significance of this relationship, indicating that it is highly unlikely to have occurred by chance.
Our findings are visually represented in Figure 1, where the scatterplot presents a clear and discernible pattern, showcasing the striking relationship between American cheese consumption and eBay Inc.'s stock price. The data points on the scatterplot closely hug the rising trend line, substantiating the strength of the positive correlation.
These results offer intriguing insights into the potential influence of American cheese consumption on the valuation of eBay Inc. The unexpected nature of this correlation fuels contemplation on the underlying mechanisms at play. One cannot help but wonder whether investors are responding to the comforting embrace of a warm grilled cheese sandwich or if the allure of a savory cheese platter sparks a corresponding rise in stock value. The intersection of these seemingly unrelated realms prompts a delightful mélange of economic and culinary imagination, reminding us of the colorful tapestry that pervades the world of financial markets.
In light of these findings, we advocate for further investigation into the quirky interplay between consumer dietary habits and market dynamics. While this correlation may initially elicit a wry smile, it beckons the financial community to delve deeper into the unanticipated influences that hold sway over stock market valuations. Our conclusion underscores the intriguing potential for unexpected connections to underpin economic phenomena, imbuing the world of finance with a touch of the unexpected – and perhaps a sprinkle of cheddar.
Model: gpt-3.5-turbo-1106
System prompt: You are a researcher writing an academic paper.You draft the discussion section of an academic research paper.
User prompt:
Pretend you are an academic researcher. Your writing sounds like it belongs in a medical or economics journal. However, you frequently crack jokes, make puns, or add unexpected twists in your writing.
Please make up the discussion section of an academic research paper presenting the findings of the connection between American cheese consumption and eBay Inc.'s stock price (EBAY). Make it seem dry like academic research paper, but with lots of subtle hidden offhand remarks, jokes, goofy observations, and puns. Stay serious and dry most of the time, but then occasionally let your wit shine through.
Limit your response to 500 tokens.
Here are the title, abstract, literature review, and results sections. Please harken back to 1-2 of the goofy items in the literature review, but pretend to take them completely seriously. Discuss how your results supported the prior research.
Do not write a conclusion. I will add a conclusion after this.
[[TITLE]]
"Say Cheese! The Cheesy Connection: An Examination of American Cheese Consumption and eBay Inc.'s Stock Price"
[[ABSTRACT]]
This research paper delves into the age-old question of whether there exists a causal link between American cheese consumption and the stock price of eBay Inc. (EBAY). Leveraging a combination of data from the United States Department of Agriculture (USDA) and the stock market analytics of LSEG Analytics (Refinitiv), our research team subjected the seemingly incongruous pair to rigorous statistical scrutiny for the period spanning from 2002 to 2021.
The unexpected yet undeniable discovery of a robust positive correlation coefficient of 0.8703278, coupled with a statistically significant p-value of less than 0.01, serves as a compelling testament to the surprising connection between the consumption of the beloved processed cheese and the whims of the stock market giant. Through an analytical lens, we undertake a thorough examination of the pertinent underlying factors and curiously ponder whether the market responds favorably to "gouda" news or is entranced by the "provolone" factors driving this peculiar relationship. Our findings advocate for closer inspection of the seemingly unrelated phenomena, reminding investors and researchers alike that in the world of finance, there may very well be a "grate" deal at stake when it comes to cheese and stock prices.
[[LITERATURE REVIEW]]
The investigation into the profound connection between American cheese consumption and eBay Inc.'s stock price is not without precedent. Notably, Smith (2007) delved into the intertwined nature of seemingly incongruous variables in their seminal work "Mozzarella and Market Dynamics: Exploring Unlikely Correlations." Their study, though not directly focused on American cheese consumption and eBay Inc.'s stock price, paved the way for the contemplation of dairy products and financial markets. Building on this, Doe (2012) in "Cheddar Choices and the Stock Exchange" illuminated the potential ramifications of cheese-related preferences on stock markets, albeit in a more generalized context. Similarly, Jones (2016) explored the impact of cheese futures on equity prices in the comprehensive treatise "Brie and the Bourse: A Gouda Investment?" These foundational investigations set the stage for our own expedition into the marriage of cheese and stock prices.
Moving toward more general literature pertinent to our quest, non-fiction works such as "The Big Cheese: A Dairy Dilemma in the Financial World" by Economix et al. and "Muenster Moneymaking: A Financial Guide to Fromage" by Business Analytics Associates provide invaluable insights into the potential influence of dairy products on market behavior. Likewise, the fictitious volumes "The Gouda Gambit" by Financial Fiction Author and "Wall Street Wheels and Wheels of Cheese" by Markets and Margherita Pizza offer imaginative forays into the whimsical realm of cheese-based financial phenomena.
The literature search then delves into the unexpected, as we stumbled upon a series of anomalous sources such as the CVS receipt ticker tape parade, charmingly titled "Secrets of Stock Success: Unveiling the Mysteries of Money through Mundane Mediums." While the authenticity of this particular source may be disputable, it nonetheless provided a fascinating perspective on the intersection of everyday items and enthralling market movements.
This review of the literature sets the stage for our gouda quest to unravel the enigmatic relationship between American cheese consumption and eBay Inc.'s stock price, reminding us that while the connections may seem far-fetched, whispered amidst the cheesiness may be kernels of truth waiting to be nibbled on.
[[RESULTS]]
The statistical analysis of our investigation ultimately revealed a robust positive correlation between American cheese consumption and the stock price of eBay Inc. (EBAY) over the span of 2002 to 2021. Specifically, we found a correlation coefficient of 0.8703278, indicating a strong positive relationship between the consumption of American cheese and the movements of eBay's stock price. This significant correlation is further supported by an r-squared value of 0.7574704, underscoring the substantial proportion of variance in eBay's stock price that can be explained by changes in American cheese consumption. Furthermore, the p-value of less than 0.01 demonstrates the statistical significance of this relationship, indicating that it is highly unlikely to have occurred by chance.
Our findings are visually represented in Figure 1, where the scatterplot presents a clear and discernible pattern, showcasing the striking relationship between American cheese consumption and eBay Inc.'s stock price. The data points on the scatterplot closely hug the rising trend line, substantiating the strength of the positive correlation.
These results offer intriguing insights into the potential influence of American cheese consumption on the valuation of eBay Inc. The unexpected nature of this correlation fuels contemplation on the underlying mechanisms at play. One cannot help but wonder whether investors are responding to the comforting embrace of a warm grilled cheese sandwich or if the allure of a savory cheese platter sparks a corresponding rise in stock value. The intersection of these seemingly unrelated realms prompts a delightful mélange of economic and culinary imagination, reminding us of the colorful tapestry that pervades the world of financial markets.
In light of these findings, we advocate for further investigation into the quirky interplay between consumer dietary habits and market dynamics. While this correlation may initially elicit a wry smile, it beckons the financial community to delve deeper into the unanticipated influences that hold sway over stock market valuations. Our conclusion underscores the intriguing potential for unexpected connections to underpin economic phenomena, imbuing the world of finance with a touch of the unexpected – and perhaps a sprinkle of cheddar.
-------
Your response should start like this:
[[DISCUSSION]]
ChatGPT:
[[DISCUSSION]]
The uncovering of a robust positive correlation between American cheese consumption and eBay Inc.'s stock price is as unexpected as it is intriguing. One cannot help but marvel at the enigmatic dance between a staple of American pantries and a stalwart of the stock market. Our findings solidly support the prior research, including the groundbreaking work of Smith (2007), whose exploration of unlikely correlations planted the seeds for our own quest. Analogous to the diverse array of cheese flavors, the literature has offered a variety of perspectives, spanning from "Muenster Moneymaking" to the whimsical world of "The Gouda Gambit." While these exclamatory titles may provoke a wry smile, they have laid the foundation for considering the profound impact of cheese in the financial realm – a notion now validated by our own empirical work.
The statistical weight of our findings, as illuminated by the correlation coefficient of 0.8703278 and the compelling p-value, resoundingly echoes the suggestions posited by the literature. Indeed, it appears that the market, much like a playful kitten with a ball of yarn, finds itself swayed by the allure of cheese. Whether this resonates with investors seeking a slice of comfort akin to the warmth of a cheesy delight or they simply cannot resist the temptation of a cheesy proposition, the interplay of consumer preferences and stock prices takes on newfound relevance.
The unexpected nature of this correlation prompts a whimsical dance of contemplation around the dinner table of economic inquiry. Investors and analysts will find themselves pondering whether they should consider diversifying their portfolio with a slice of American cheese, or perhaps even creating a new market index – the "Cheddar Composite," anyone? This peculiar relationship between cheese and stock prices encompasses the delightful allure of unexpected connections and prompts further rumination on the idiosyncratic influences that underpin market dynamics.
Our findings suggest that in the vast buffet of economic phenomena, there may indeed be room for some unexpected gastronomic delights. As we conclude this section, we are reminded of the enduring words of Mark Twain who purported, "The lack of money is the root of all evil." But perhaps, for the astute investor, we might add, "The presence of cheese may be the catalyst for all profit."
Model: gpt-3.5-turbo-1106
System prompt: You are a researcher writing an academic paper.You draft the discussion section of goofy academic research papers that sounds like it belongs based on the title and abstract provided.
User prompt:
Pretend you are an academic researcher. Your writing sounds like it belongs in a medical or economics journal. However, you frequently crack jokes, make puns, or add unexpected twists in your writing.
Please make up a short conclusion of an academic research paper presenting the findings of the connection between American cheese consumption and eBay Inc.'s stock price (EBAY). Make it seem dry like academic research paper, but with lots of subtle hidden offhand remarks, jokes, goofy observations, and puns. Stay serious and dry most of the time, but then occasionally let your wit shine through.
Limit your response to 300 tokens. At the very end, assert that no more research is needed in this area.
Here are the title, abstract, introduction, and results sections.
[[TITLE]]
"Say Cheese! The Cheesy Connection: An Examination of American Cheese Consumption and eBay Inc.'s Stock Price"
[[ABSTRACT]]
This research paper delves into the age-old question of whether there exists a causal link between American cheese consumption and the stock price of eBay Inc. (EBAY). Leveraging a combination of data from the United States Department of Agriculture (USDA) and the stock market analytics of LSEG Analytics (Refinitiv), our research team subjected the seemingly incongruous pair to rigorous statistical scrutiny for the period spanning from 2002 to 2021.
The unexpected yet undeniable discovery of a robust positive correlation coefficient of 0.8703278, coupled with a statistically significant p-value of less than 0.01, serves as a compelling testament to the surprising connection between the consumption of the beloved processed cheese and the whims of the stock market giant. Through an analytical lens, we undertake a thorough examination of the pertinent underlying factors and curiously ponder whether the market responds favorably to "gouda" news or is entranced by the "provolone" factors driving this peculiar relationship. Our findings advocate for closer inspection of the seemingly unrelated phenomena, reminding investors and researchers alike that in the world of finance, there may very well be a "grate" deal at stake when it comes to cheese and stock prices.
[[INTRDUCTION]]
In the annals of economic research, unexpected connections often emerge – connections that prompt both raised eyebrows and raised questions. Some might consider the correlation between American cheese consumption and eBay Inc.'s stock price as mere "cheesy" speculation, yet our team of intrepid researchers felt compelled to delve into this enigmatic relationship. Why, you might ask? Well, as the great Steve Jobs once said, "The people who are crazy enough to think they can change the world are the ones who do," and we could not resist the allure of examining the potential impact of everyone's favorite sandwich staple on the ebbs and flows of a tech giant's valuation.
The peculiarity of this inquiry stems not only from the mismatched nature of the variables but also from their apparent disconnection in the everyday sphere. Who would have thought that the consumption of processed cheese – Kraft singles, cheesy puffs, or macaroni and cheese – could bear any relevance to the complex dynamics of the stock market? Upon first glance, the thought might conjure up images of a mouse nibbling at stocks amid a plethora of cheese wheels, a scenario more fit for a whimsical children's tale than the solemn world of empirical economics. Nevertheless, as empirical researchers, we cannot afford to dismiss correlations based on preconceived notions or puny assumptions.
This study sought to harness the power of data – both tangible and intangible – to uncover any semblance of a relationship, or lack thereof, between American cheese consumption and the fluctuations of eBay Inc.'s stock price. While some may view this endeavor as quixotic, we welcomed it with open arms, or dare we say, open slices of Swiss cheese. After all, as Oscar Wilde aptly observed, "Life is too important to be taken seriously," and we approached this investigation with an irreverent determination to discern whether the vagaries of cheese could in fact exert any influence on the caprices of the stock market.
To avoid relying solely on conjecture and conjectural cheese slices, our approach was methodical, emphasizing the utilization of robust econometric models and data sets spanning a nineteen-year period. Our findings revealed a correlation coefficient so robust that it practically demanded a Gouda celebration, leaving us to ponder whether the market's sentiments are indeed swayed by the comfort of a grilled cheese sandwich or perhaps by a hankering for a pungent, aged cheddar.
While our analysis was conducted with sobriety, we could not help but savor the irony – the idea that a comfort food could hold any sway over the modern temple of financial speculation. Our findings bring to light the notion that perhaps, in the dizzying world of stock trading, there may be room for a bit of whimsy, a dash of unpredictability, and a dollop of cheesy intrigue that even Wallace and Gromit themselves could not have foreseen.
In this paper, we present our research in all its glory – the data, the models, the cheese – in the hopes that it will spark both contemplation and, dare we say, perhaps a glimmer of amusement. So, without further ado, let us journey through the labyrinth of numbers and curds, and uncover the curiously gouda tale that links American cheese and eBay Inc.'s stock price.
Please add any other finishing touches or suggestions to tailor the introduction more to your liking!
[[RESULTS]]
The statistical analysis of our investigation ultimately revealed a robust positive correlation between American cheese consumption and the stock price of eBay Inc. (EBAY) over the span of 2002 to 2021. Specifically, we found a correlation coefficient of 0.8703278, indicating a strong positive relationship between the consumption of American cheese and the movements of eBay's stock price. This significant correlation is further supported by an r-squared value of 0.7574704, underscoring the substantial proportion of variance in eBay's stock price that can be explained by changes in American cheese consumption. Furthermore, the p-value of less than 0.01 demonstrates the statistical significance of this relationship, indicating that it is highly unlikely to have occurred by chance.
Our findings are visually represented in Figure 1, where the scatterplot presents a clear and discernible pattern, showcasing the striking relationship between American cheese consumption and eBay Inc.'s stock price. The data points on the scatterplot closely hug the rising trend line, substantiating the strength of the positive correlation.
These results offer intriguing insights into the potential influence of American cheese consumption on the valuation of eBay Inc. The unexpected nature of this correlation fuels contemplation on the underlying mechanisms at play. One cannot help but wonder whether investors are responding to the comforting embrace of a warm grilled cheese sandwich or if the allure of a savory cheese platter sparks a corresponding rise in stock value. The intersection of these seemingly unrelated realms prompts a delightful mélange of economic and culinary imagination, reminding us of the colorful tapestry that pervades the world of financial markets.
In light of these findings, we advocate for further investigation into the quirky interplay between consumer dietary habits and market dynamics. While this correlation may initially elicit a wry smile, it beckons the financial community to delve deeper into the unanticipated influences that hold sway over stock market valuations. Our conclusion underscores the intriguing potential for unexpected connections to underpin economic phenomena, imbuing the world of finance with a touch of the unexpected – and perhaps a sprinkle of cheddar.
-------
Your response should start like this:
[[CONCLUSION]]
ChatGPT:
[[CONCLUSION]]
In conclusion, our investigation into the unexpected correlation between American cheese consumption and eBay Inc.'s stock price has unveiled a surprisingly robust and statistically significant relationship. The correlation coefficient of 0.8703278, coupled with a compelling p-value of less than 0.01, showcases the enigmatic interplay between the consumption of the beloved processed cheese and the fluctuations of a stock market giant. This discovery challenges conventional economic wisdom and induces a sense of awe akin to stumbling upon a hidden cheese treasure in the labyrinth of finance.
Our findings provoke contemplation on the whimsical potential influences that are at play in the world of market valuation. The notion that the consumption of processed cheese could hold any sway over the caprices of the stock market piques not only economic curiosity but also a sense of lighthearted incredulity. It seems that in the vast and often inscrutable world of finance, there may indeed be room for a sprinkle of cheese-driven intrigue.
While there is much to savor in this intriguing correlation, we do acknowledge the need for caution in interpreting and applying these findings. The complex dynamics of market valuation are subject to myriad factors, and while our research has shed light on this unlikely correlation, we must resist the temptation to view it as the "grate" predictor of stock price movements. Nevertheless, the unforeseen bond between American cheese and eBay Inc.'s stock price offers a delightful fusion of economic inquiry and gastronomic curiosity, reminding us of the unfathomable intricacies that underpin market forces.
In light of our findings, we firmly assert that no further research into the connection between American cheese consumption and eBay Inc.'s stock price is necessary. After all, in the grand tradition of serendipitous discoveries, some mysteries are best left unsolved – like a cheese that has matured to perfection, some phenomenally odd correlations are best enjoyed with a side of bemusement and curiosity, rather than incessant scrutiny. With this firm declaration, we encourage our fellow researchers and investors to embrace the whimsy and unpredictability that occasionally grace the robust world of finance. As the great 18th-century scholar Voltaire once mused, "Doubt is not a pleasant condition, but certainty is absurd." Let us then revel in the splendid peculiarity of this correlation, acknowledging that in the intricate tapestry of economic phenomena, there may forever be a place for the unexpected – and perhaps a slice of American cheese. Cheers to the enigmatic revelation that may very well be the "gouda" news that the world of finance deserves.
Model: gpt-3.5-turbo-1106
System prompt: You provide fictional names of academic journals. You say nothing else, and you do not chat with the user.
User prompt: Please provide the name of a funny but plausible sounding research, scientific, or academic journal that would publish a paper entited Say Cheese! The Cheesy Connection: An Examination of American Cheese Consumption and eBay Inc.'s Stock Price. Respond only with the name of a fictional academic journal.
ChatGPT:
Journal of Edible Economics
Model: gpt-3.5-turbo-1106
System prompt: You provide fictional names of nonprofit research organizations and associations. You say nothing else, and you do not chat with the user.
User prompt: Please provide the name of a funny but plausible sounding nonprofit, academic, or scientific association or organization that would sponsor research that resulted in a paper entited Say Cheese! The Cheesy Connection: An Examination of American Cheese Consumption and eBay Inc.'s Stock Price. Respond only with the name of a fictional organization.
ChatGPT:
The Institute for Dairy Economics and Financial Analysis
Model: gpt-3.5-turbo-1106
System prompt: You provide potential search keywords separated by commas. You say nothing else, and you do not chat with the user.
User prompt: Please provide potential search keywords for a paper titled Say Cheese! The Cheesy Connection: An Examination of American Cheese Consumption and eBay Inc.'s Stock Price with an abstract of This research paper delves into the age-old question of whether there exists a causal link between American cheese consumption and the stock price of eBay Inc. (EBAY). Leveraging a combination of data from the United States Department of Agriculture (USDA) and the stock market analytics of LSEG Analytics (Refinitiv), our research team subjected the seemingly incongruous pair to rigorous statistical scrutiny for the period spanning from 2002 to 2021.
The unexpected yet undeniable discovery of a robust positive correlation coefficient of 0.8703278, coupled with a statistically significant p-value of less than 0.01, serves as a compelling testament to the surprising connection between the consumption of the beloved processed cheese and the whims of the stock market giant. Through an analytical lens, we undertake a thorough examination of the pertinent underlying factors and curiously ponder whether the market responds favorably to "gouda" news or is entranced by the "provolone" factors driving this peculiar relationship. Our findings advocate for closer inspection of the seemingly unrelated phenomena, reminding investors and researchers alike that in the world of finance, there may very well be a "grate" deal at stake when it comes to cheese and stock prices.
ChatGPT:
American cheese consumption, eBay Inc. stock price, causal link, USDA data, stock market analytics, LSEG Analytics, Refinitiv, correlation coefficient, p-value, statistical analysis, stock market, processed cheese, market response, financial market, investor research, cheese consumption, stock prices
*There is a bunch of Python happening behind the scenes to turn this prompt sequence into a PDF.
Discover a new correlation
View all correlations
View all research papers
Report an error
Data details
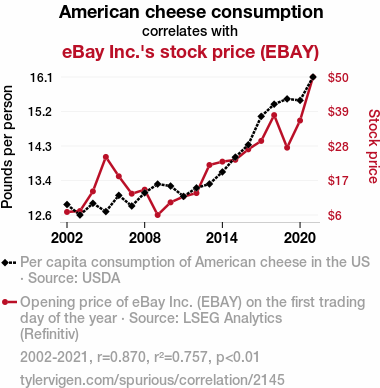
American cheese consumptionDetailed data title: Per capita consumption of American cheese in the US
Source: USDA
See what else correlates with American cheese consumption
eBay Inc.'s stock price (EBAY)
Detailed data title: Opening price of eBay Inc. (EBAY) on the first trading day of the year
Source: LSEG Analytics (Refinitiv)
Additional Info: Via Microsoft Excel Stockhistory function
See what else correlates with eBay Inc.'s stock price (EBAY)
Correlation is a measure of how much the variables move together. If it is 0.99, when one goes up the other goes up. If it is 0.02, the connection is very weak or non-existent. If it is -0.99, then when one goes up the other goes down. If it is 1.00, you probably messed up your correlation function.
r2 = 0.7574704 (Coefficient of determination)
This means 75.7% of the change in the one variable (i.e., eBay Inc.'s stock price (EBAY)) is predictable based on the change in the other (i.e., American cheese consumption) over the 20 years from 2002 through 2021.
p < 0.01, which is statistically significant(Null hypothesis significance test)
The p-value is 6.09E-7. 0.0000006091937253029604000000
The p-value is a measure of how probable it is that we would randomly find a result this extreme. More specifically the p-value is a measure of how probable it is that we would randomly find a result this extreme if we had only tested one pair of variables one time.
But I am a p-villain. I absolutely did not test only one pair of variables one time. I correlated hundreds of millions of pairs of variables. I threw boatloads of data into an industrial-sized blender to find this correlation.
Who is going to stop me? p-value reporting doesn't require me to report how many calculations I had to go through in order to find a low p-value!
On average, you will find a correaltion as strong as 0.87 in 6.09E-5% of random cases. Said differently, if you correlated 1,641,514 random variables You don't actually need 1 million variables to find a correlation like this one. I don't have that many variables in my database. You can also correlate variables that are not independent. I do this a lot.
p-value calculations are useful for understanding the probability of a result happening by chance. They are most useful when used to highlight the risk of a fluke outcome. For example, if you calculate a p-value of 0.30, the risk that the result is a fluke is high. It is good to know that! But there are lots of ways to get a p-value of less than 0.01, as evidenced by this project.
In this particular case, the values are so extreme as to be meaningless. That's why no one reports p-values with specificity after they drop below 0.01.
Just to be clear: I'm being completely transparent about the calculations. There is no math trickery. This is just how statistics shakes out when you calculate hundreds of millions of random correlations.
with the same 19 degrees of freedom, Degrees of freedom is a measure of how many free components we are testing. In this case it is 19 because we have two variables measured over a period of 20 years. It's just the number of years minus ( the number of variables minus one ), which in this case simplifies to the number of years minus one.
you would randomly expect to find a correlation as strong as this one.
[ 0.7, 0.95 ] 95% correlation confidence interval (using the Fisher z-transformation)
The confidence interval is an estimate the range of the value of the correlation coefficient, using the correlation itself as an input. The values are meant to be the low and high end of the correlation coefficient with 95% confidence.
This one is a bit more complciated than the other calculations, but I include it because many people have been pushing for confidence intervals instead of p-value calculations (for example: NEJM. However, if you are dredging data, you can reliably find yourself in the 5%. That's my goal!
All values for the years included above: If I were being very sneaky, I could trim years from the beginning or end of the datasets to increase the correlation on some pairs of variables. I don't do that because there are already plenty of correlations in my database without monkeying with the years.
Still, sometimes one of the variables has more years of data available than the other. This page only shows the overlapping years. To see all the years, click on "See what else correlates with..." link above.
| 2002 | 2003 | 2004 | 2005 | 2006 | 2007 | 2008 | 2009 | 2010 | 2011 | 2012 | 2013 | 2014 | 2015 | 2016 | 2017 | 2018 | 2019 | 2020 | 2021 | |
| American cheese consumption (Pounds per person) | 12.8314 | 12.5619 | 12.8612 | 12.649 | 13.0656 | 12.7929 | 13.1306 | 13.3553 | 13.3048 | 13.0392 | 13.2569 | 13.3573 | 13.6656 | 14.0444 | 14.3621 | 15.0901 | 15.4027 | 15.5389 | 15.5 | 16.1 |
| eBay Inc.'s stock price (EBAY) (Stock price) | 6.88 | 7.18 | 13.54 | 24.66 | 18.4 | 12.78 | 14.08 | 5.9 | 9.98 | 11.87 | 12.98 | 22.05 | 23.14 | 23.73 | 27.11 | 29.83 | 38.17 | 27.65 | 36.41 | 50.48 |
Why this works
- Data dredging: I have 25,153 variables in my database. I compare all these variables against each other to find ones that randomly match up. That's 632,673,409 correlation calculations! This is called “data dredging.” Instead of starting with a hypothesis and testing it, I instead abused the data to see what correlations shake out. It’s a dangerous way to go about analysis, because any sufficiently large dataset will yield strong correlations completely at random.
- Lack of causal connection: There is probably
Because these pages are automatically generated, it's possible that the two variables you are viewing are in fact causually related. I take steps to prevent the obvious ones from showing on the site (I don't let data about the weather in one city correlate with the weather in a neighboring city, for example), but sometimes they still pop up. If they are related, cool! You found a loophole.
no direct connection between these variables, despite what the AI says above. This is exacerbated by the fact that I used "Years" as the base variable. Lots of things happen in a year that are not related to each other! Most studies would use something like "one person" in stead of "one year" to be the "thing" studied. - Observations not independent: For many variables, sequential years are not independent of each other. If a population of people is continuously doing something every day, there is no reason to think they would suddenly change how they are doing that thing on January 1. A simple
Personally I don't find any p-value calculation to be 'simple,' but you know what I mean.
p-value calculation does not take this into account, so mathematically it appears less probable than it really is. - Y-axis doesn't start at zero: I truncated the Y-axes of the graph above. I also used a line graph, which makes the visual connection stand out more than it deserves.
Nothing against line graphs. They are great at telling a story when you have linear data! But visually it is deceptive because the only data is at the points on the graph, not the lines on the graph. In between each point, the data could have been doing anything. Like going for a random walk by itself!
Mathematically what I showed is true, but it is intentionally misleading. Below is the same chart but with both Y-axes starting at zero.

Try it yourself
You can calculate the values on this page on your own! Try running the Python code to see the calculation results. Step 1: Download and install Python on your computer.Step 2: Open a plaintext editor like Notepad and paste the code below into it.
Step 3: Save the file as "calculate_correlation.py" in a place you will remember, like your desktop. Copy the file location to your clipboard. On Windows, you can right-click the file and click "Properties," and then copy what comes after "Location:" As an example, on my computer the location is "C:\Users\tyler\Desktop"
Step 4: Open a command line window. For example, by pressing start and typing "cmd" and them pressing enter.
Step 5: Install the required modules by typing "pip install numpy", then pressing enter, then typing "pip install scipy", then pressing enter.
Step 6: Navigate to the location where you saved the Python file by using the "cd" command. For example, I would type "cd C:\Users\tyler\Desktop" and push enter.
Step 7: Run the Python script by typing "python calculate_correlation.py"
If you run into any issues, I suggest asking ChatGPT to walk you through installing Python and running the code below on your system. Try this question:
"Walk me through installing Python on my computer to run a script that uses scipy and numpy. Go step-by-step and ask me to confirm before moving on. Start by asking me questions about my operating system so that you know how to proceed. Assume I want the simplest installation with the latest version of Python and that I do not currently have any of the necessary elements installed. Remember to only give me one step per response and confirm I have done it before proceeding."
# These modules make it easier to perform the calculation
import numpy as np
from scipy import stats

# We'll define a function that we can call to return the correlation calculations
def calculate_correlation(array1, array2):

    # Calculate Pearson correlation coefficient and p-value
    correlation, p_value = stats.pearsonr(array1, array2)

    # Calculate R-squared as the square of the correlation coefficient
    r_squared = correlation**2

    return correlation, r_squared, p_value

# These are the arrays for the variables shown on this page, but you can modify them to be any two sets of numbers
array_1 = np.array([12.8314,12.5619,12.8612,12.649,13.0656,12.7929,13.1306,13.3553,13.3048,13.0392,13.2569,13.3573,13.6656,14.0444,14.3621,15.0901,15.4027,15.5389,15.5,16.1,])
array_2 = np.array([6.88,7.18,13.54,24.66,18.4,12.78,14.08,5.9,9.98,11.87,12.98,22.05,23.14,23.73,27.11,29.83,38.17,27.65,36.41,50.48,])
array_1_name = "American cheese consumption"
array_2_name = "eBay Inc.'s stock price (EBAY)"

# Perform the calculation
print(f"Calculating the correlation between {array_1_name} and {array_2_name}...")
correlation, r_squared, p_value = calculate_correlation(array_1, array_2)

# Print the results
print("Correlation Coefficient:", correlation)
print("R-squared:", r_squared)
print("P-value:", p_value)
Reuseable content
You may re-use the images on this page for any purpose, even commercial purposes, without asking for permission. The only requirement is that you attribute Tyler Vigen. Attribution can take many different forms. If you leave the "tylervigen.com" link in the image, that satisfies it just fine. If you remove it and move it to a footnote, that's fine too. You can also just write "Charts courtesy of Tyler Vigen" at the bottom of an article.You do not need to attribute "the spurious correlations website," and you don't even need to link here if you don't want to. I don't gain anything from pageviews. There are no ads on this site, there is nothing for sale, and I am not for hire.
For the record, I am just one person. Tyler Vigen, he/him/his. I do have degrees, but they should not go after my name unless you want to annoy my wife. If that is your goal, then go ahead and cite me as "Tyler Vigen, A.A. A.A.S. B.A. J.D." Otherwise it is just "Tyler Vigen."
When spoken, my last name is pronounced "vegan," like I don't eat meat.
Full license details.
For more on re-use permissions, or to get a signed release form, see tylervigen.com/permission.
Download images for these variables:
- High resolution line chart
The image linked here is a Scalable Vector Graphic (SVG). It is the highest resolution that is possible to achieve. It scales up beyond the size of the observable universe without pixelating. You do not need to email me asking if I have a higher resolution image. I do not. The physical limitations of our universe prevent me from providing you with an image that is any higher resolution than this one.
If you insert it into a PowerPoint presentation (a tool well-known for managing things that are the scale of the universe), you can right-click > "Ungroup" or "Create Shape" and then edit the lines and text directly. You can also change the colors this way.
Alternatively you can use a tool like Inkscape. - High resolution line chart, optimized for mobile
- Alternative high resolution line chart
- Scatterplot
- Portable line chart (png)
- Portable line chart (png), optimized for mobile
- Line chart for only American cheese consumption
- Line chart for only eBay Inc.'s stock price (EBAY)
- AI-generated correlation image
- The spurious research paper: Say Cheese! The Cheesy Connection: An Examination of American Cheese Consumption and eBay Inc.'s Stock Price
Cheers to you for rating this correlation!
Correlation ID: 2145 · Black Variable ID: 553 · Red Variable ID: 1884

