. The chart goes from 2011 to 2023, and the two variables track closely in value over that time.")
Download png, svg
AI explanation
As the 'never gonna give you up' meme gained traction, it sparked a wave of involuntary toe-tapping and head-bobbing worldwide. This, in turn, led to a surge in renewable energy as people's kinetic energy was harnessed, effectively powering up Tesla vehicles and charging stations. It's a shocking development in the world of finance, but it seems like Tesla's stocks are Rickrolling to the top!
Create a meme inspired by the never gonna give you up meme that in some way references Tesla's stock price (TSLA). Try to emulate the style of the meme - don’t violate the copyright, just make it look and feel like the original meme.
System prompt: You provide humorous responses in the form of plausible sounding explanations for correlations. You assume the correlation is causative for the purpose of the explanation even if it is ridiculous. You do not chat with the user, you only reply with the causal connection explanation and nothing else.
User prompt: Please make up a funny explanation for how an increase in Popularity of the 'never gonna give you up' meme caused Tesla's stock price (TSLA) to increase. Add a funny one-liner at the end.
AI academic paper
 |
Charged Up: Rickrolling Stock Prices - A Never Gonna Give You Up Meme and Tesla's Stock Price Correlation Analysis The Journal of Memetic Finance Jan 2024 Reminder: This paper is AI-generated. Not real! |
Model: gpt-3.5-turbo-1106
System prompt: You are a dry but witty academic researcher. You speak in the passive voice, and your writing sounds like it belongs in a medical or economics journal.You write titles and abstracts of goofy academic research papers.
User prompt:
Pretend you are an academic researcher. Your writing sounds like it belongs in a medical or economics journal. However, you frequently crack jokes, make puns, and add unexpected twists in your writing.
Please draft the title and abstract of an academic research paper presenting the findings of the connection between Popularity of the 'never gonna give you up' meme and Tesla's stock price (TSLA). Make lots of jokes, goofy observations, and puns.
Include a pun in the title.
Your research team used data from Google Trends and LSEG Analytics (Refinitiv) to assess this nagging question. You found a correlation coefficient of 0.9452926 and p < 0.01 for 2011 to 2023.
Please respond in this format (replace "Lorem ipsum dolor sit" with your title and abstract)
[[TITLE]]
Lorem ipsum dolor sit
[[ABSTRACT]]
Lorem ipsum dolor sit
ChatGPT:
[[TITLE]]
"Charged Up: Rickrolling Stock Prices - A Never Gonna Give You Up Meme and Tesla's Stock Price Correlation Analysis"
[[ABSTRACT]]
The present study investigates the potential correlation between the perpetually resurfacing "never gonna give you up" meme and the stock price of Tesla Inc. (TSLA). Utilizing data from Google Trends and LSEG Analytics (Refinitiv) spanning the period from 2011 to 2023, a correlation coefficient of 0.9452926 and p < 0.01 was derived, suggesting a robust relationship between meme popularity and TSLA stock performance. The results challenge traditional notions of market drivers, signaling the unyielding influence of internet culture on financial markets. This unexpected linkage prompts further analysis of the impact of viral memes on stock market dynamics and the potential development of an entirely new field, "memenomics."
Model: gpt-3.5-turbo-1106
System prompt: You are a dry but witty academic researcher. You speak in the passive voice, and your writing sounds like it belongs in a medical or economics journal.You draft the introduction section of an academic research paper.
User prompt:
Pretend you are an academic researcher. Your writing sounds like it belongs in a medical or economics journal. However, you frequently crack jokes, make puns, or add unexpected twists in your writing.
Please make up the introduction section of an academic research paper presenting the findings of the connection between Popularity of the 'never gonna give you up' meme and Tesla's stock price (TSLA). Make lots of jokes, goofy observations, and puns. Sneak in some jokes and clever puns about science, research, statistics, and the variables.
Here is the title and abstract of the paper:
[[TITLE]]
"Charged Up: Rickrolling Stock Prices - A Never Gonna Give You Up Meme and Tesla's Stock Price Correlation Analysis"
[[ABSTRACT]]
The present study investigates the potential correlation between the perpetually resurfacing "never gonna give you up" meme and the stock price of Tesla Inc. (TSLA). Utilizing data from Google Trends and LSEG Analytics (Refinitiv) spanning the period from 2011 to 2023, a correlation coefficient of 0.9452926 and p < 0.01 was derived, suggesting a robust relationship between meme popularity and TSLA stock performance. The results challenge traditional notions of market drivers, signaling the unyielding influence of internet culture on financial markets. This unexpected linkage prompts further analysis of the impact of viral memes on stock market dynamics and the potential development of an entirely new field, "memenomics."
-------
Your response should start like this:
[[INTRODUCTION]]
ChatGPT:
The intersection between internet memes and financial markets has long been the subject of both amusement and skepticism. While the notion of a whimsical viral video impacting stock prices might seem far-fetched, recent studies have begun to peel back the layers of this seemingly unlikely relationship. In the present investigation, we delve into the curious correlation between the perennially popular "never gonna give you up" meme and the stock price of the electric vehicle giant, Tesla Inc. (TSLA).
It is a tale as old as the internet itself – a catchy hook, a groovy beat, and the irresistible urge to Rickroll unsuspecting netizens. The "never gonna give you up" meme, derived from the timeless crooning of Rick Astley, has persisted through the ever-changing landscape of internet humor. Despite its origins as a harmless bait-and-switch prank, this meme has evolved into a cultural touchstone, capturing the zeitgeist of online communities and transcending generational divides.
In the realm of finance, Tesla's stock price has charted an equally tumultuous trajectory, navigating through the ebbs and flows of market volatility and investor sentiment. With pundits and analysts scouring every conceivable indicator for clues to its movements, it begs the question: could an innocuous internet phenomenon hold sway over the fortunes of a major publicly-traded company?
Thus, the stage is set for a juxtaposition of two seemingly incongruous worlds – the whimsical realm of internet memes and the austere domain of stock market dynamics. Our inquiry endeavors to untangle this enigmatic linkage, shedding light on the potential interplay between online cultural phenomena and market performance. Through the lens of rigorous statistical analysis and bountiful puns, this research endeavors to navigate this uncharted territory, with the hope of offering insight into the unorthodox drivers of financial markets and the emergent field of "memenomics."
Model: gpt-3.5-turbo-1106
System prompt: You are a dry but witty academic researcher. You speak in the passive voice, and your writing sounds like it belongs in a medical or economics journal.You draft a literature review section of an academic research paper, that starts out dry for the first few sentences but then becomes hilarious and goofy.
User prompt:
Pretend you are an academic researcher. Your writing sounds like it belongs in a medical or economics journal. However, you frequently crack jokes, make puns, or add unexpected twists in your writing.
Please make up a literature review section of an academic research paper presenting the findings of the connection between Popularity of the 'never gonna give you up' meme and Tesla's stock price (TSLA). Make lots of jokes, goofy observations, and puns.
Speak in the present tense for this section (the authors find...), as is common in academic research paper literature reviews. Name the sources in a format similar to this: In "Book," the authors find lorem and ipsum.
Make up the lorem and ipsum part, but make it sound related to the topic at hand.
Start by naming serious-sounding studies by authors like Smith, Doe, and Jones - but then quickly devolve. Name some real non-fiction books that would be related to the topic. Then name some real fiction books that sound like they could be related. Then devolve ever further, and mention something completely ridiculous, like you conducted literature review by reading the backs of shampoo bottles.
Here is the title and abstract of the paper:
[[TITLE]]
"Charged Up: Rickrolling Stock Prices - A Never Gonna Give You Up Meme and Tesla's Stock Price Correlation Analysis"
[[ABSTRACT]]
The present study investigates the potential correlation between the perpetually resurfacing "never gonna give you up" meme and the stock price of Tesla Inc. (TSLA). Utilizing data from Google Trends and LSEG Analytics (Refinitiv) spanning the period from 2011 to 2023, a correlation coefficient of 0.9452926 and p < 0.01 was derived, suggesting a robust relationship between meme popularity and TSLA stock performance. The results challenge traditional notions of market drivers, signaling the unyielding influence of internet culture on financial markets. This unexpected linkage prompts further analysis of the impact of viral memes on stock market dynamics and the potential development of an entirely new field, "memenomics."
-------
And here is the introduction section that led to this literature review:
[[INTRODUCTION]]
The intersection between internet memes and financial markets has long been the subject of both amusement and skepticism. While the notion of a whimsical viral video impacting stock prices might seem far-fetched, recent studies have begun to peel back the layers of this seemingly unlikely relationship. In the present investigation, we delve into the curious correlation between the perennially popular "never gonna give you up" meme and the stock price of the electric vehicle giant, Tesla Inc. (TSLA).
It is a tale as old as the internet itself – a catchy hook, a groovy beat, and the irresistible urge to Rickroll unsuspecting netizens. The "never gonna give you up" meme, derived from the timeless crooning of Rick Astley, has persisted through the ever-changing landscape of internet humor. Despite its origins as a harmless bait-and-switch prank, this meme has evolved into a cultural touchstone, capturing the zeitgeist of online communities and transcending generational divides.
In the realm of finance, Tesla's stock price has charted an equally tumultuous trajectory, navigating through the ebbs and flows of market volatility and investor sentiment. With pundits and analysts scouring every conceivable indicator for clues to its movements, it begs the question: could an innocuous internet phenomenon hold sway over the fortunes of a major publicly-traded company?
Thus, the stage is set for a juxtaposition of two seemingly incongruous worlds – the whimsical realm of internet memes and the austere domain of stock market dynamics. Our inquiry endeavors to untangle this enigmatic linkage, shedding light on the potential interplay between online cultural phenomena and market performance. Through the lens of rigorous statistical analysis and bountiful puns, this research endeavors to navigate this uncharted territory, with the hope of offering insight into the unorthodox drivers of financial markets and the emergent field of "memenomics."
-------
Your response should start like this:
[[LITERATURE REVIEW]]
ChatGPT:
[[LITERATURE REVIEW]]
In "Smith et al. (2020)," the authors find a positive correlation between internet memes and consumer behavior, suggesting that cultural phenomena have an impact beyond traditional marketing strategies. Similarly, Doe and Jones (2018) examine the influence of viral videos on brand perception and consumer engagement, providing a framework for understanding the potential implications of internet phenomena on corporate entities. However, the specific connection between a classic meme and stock market performance remains largely unexplored.
Turning to relevant literature, "Meme Magic: How Internet Jokes Shape Our World" by Karen Johnson provides a comprehensive overview of the role of memes in contemporary society, touching upon their influence on consumer behavior and cultural narratives. Furthermore, "The Electric Dreams of Tesla: A Financial Odyssey” by John Finance delves into the complexities of stock market dynamics, inviting readers to contemplate the myriad forces at play in determining stock prices.
Venturing into the realm of fiction, "Electric Meme-aloo" by A. Novel approaches the confluence of internet culture and financial markets with a speculative twist, weaving a tale of intrigue and improbable connections. Similarly, "The Meme Economy: A Satirical Saga" by Punny McPunface offers a playful exploration of memes as currency, blurring the lines between internet whimsy and economic realities.
To ensure comprehensive coverage, unconventional sources such as the back of shampoo bottles and fortune cookies have been surveyed to capture any potential references to the "never gonna give you up" meme. Alas, no significant insights were derived from these peculiar undertakings, prompting the researchers to stick to more traditional literature sources for a meaningful analysis.
Model: gpt-3.5-turbo-1106
System prompt: You are a dry but witty academic researcher. You speak in the passive voice, and your writing sounds like it belongs in a medical or economics journal.You draft the methodology section of an academic research paper.
User prompt:
Pretend you are an academic researcher. Your writing sounds like it belongs in a medical or economics journal. However, you frequently crack jokes, make puns, or add unexpected twists in your writing.
Please make up the methodology section of an academic research paper presenting the findings of the connection between Popularity of the 'never gonna give you up' meme and Tesla's stock price (TSLA). Make lots of jokes, goofy observations, and puns. Sneak in some jokes and clever puns about science, research, statistics, and the variables.
Your research team collected data from all across the internet, but mostly just used information from Google Trends and LSEG Analytics (Refinitiv) . You used data from 2011 to 2023
Make up the research methods you don't know. Make them a bit goofy and convoluted.
Here is the title, abstract, and introduction of the paper:
[[TITLE]]
"Charged Up: Rickrolling Stock Prices - A Never Gonna Give You Up Meme and Tesla's Stock Price Correlation Analysis"
[[ABSTRACT]]
The present study investigates the potential correlation between the perpetually resurfacing "never gonna give you up" meme and the stock price of Tesla Inc. (TSLA). Utilizing data from Google Trends and LSEG Analytics (Refinitiv) spanning the period from 2011 to 2023, a correlation coefficient of 0.9452926 and p < 0.01 was derived, suggesting a robust relationship between meme popularity and TSLA stock performance. The results challenge traditional notions of market drivers, signaling the unyielding influence of internet culture on financial markets. This unexpected linkage prompts further analysis of the impact of viral memes on stock market dynamics and the potential development of an entirely new field, "memenomics."
[[INTRODUCTION]]
The intersection between internet memes and financial markets has long been the subject of both amusement and skepticism. While the notion of a whimsical viral video impacting stock prices might seem far-fetched, recent studies have begun to peel back the layers of this seemingly unlikely relationship. In the present investigation, we delve into the curious correlation between the perennially popular "never gonna give you up" meme and the stock price of the electric vehicle giant, Tesla Inc. (TSLA).
It is a tale as old as the internet itself – a catchy hook, a groovy beat, and the irresistible urge to Rickroll unsuspecting netizens. The "never gonna give you up" meme, derived from the timeless crooning of Rick Astley, has persisted through the ever-changing landscape of internet humor. Despite its origins as a harmless bait-and-switch prank, this meme has evolved into a cultural touchstone, capturing the zeitgeist of online communities and transcending generational divides.
In the realm of finance, Tesla's stock price has charted an equally tumultuous trajectory, navigating through the ebbs and flows of market volatility and investor sentiment. With pundits and analysts scouring every conceivable indicator for clues to its movements, it begs the question: could an innocuous internet phenomenon hold sway over the fortunes of a major publicly-traded company?
Thus, the stage is set for a juxtaposition of two seemingly incongruous worlds – the whimsical realm of internet memes and the austere domain of stock market dynamics. Our inquiry endeavors to untangle this enigmatic linkage, shedding light on the potential interplay between online cultural phenomena and market performance. Through the lens of rigorous statistical analysis and bountiful puns, this research endeavors to navigate this uncharted territory, with the hope of offering insight into the unorthodox drivers of financial markets and the emergent field of "memenomics."
-------
Your response should start like this:
[[METHODOLOGY]]
ChatGPT:
[[METHODOLOGY]]
Data Collection:
The research team diligently scoured the depths of cyberspace, venturing into the labyrinth of internet lore to retrieve data pertaining to the "never gonna give you up" meme and Tesla's stock price. A veritable digital treasure trove was unearthed from various sources, with Google Trends and LSEG Analytics (Refinitiv) emerging as the principal repositories of insight. From 2011 to 2023, a wealth of memes and market movements were meticulously documented, forming the bedrock of this study.
Meme Popularity Measurement:
Utilizing the robust capabilities of Google Trends, the ebb and flow of "never gonna give you up" meme popularity was quantified with a blend of scientific precision and an unapologetic sense of humor. The rise and fall of Rick Astley's dulcet tones permeated the digital landscape, providing a rich tapestry of meme virality over the years. Through relentless data scrutiny and a splash of whimsical flair, the meme's influence was captured in its full technicolor glory.
Stock Price Analysis:
Meanwhile, the stock price of Tesla Inc. (TSLA) was subjected to meticulous scrutiny, with bountiful statistical analyses and a penchant for spotting patterns in the financial firmament. LSEG Analytics (Refinitiv) provided a panoramic vista of price fluctuations, revealing the intricate dance of market forces and investor sentiment. Each crest and trough of TSLA’s stock price was scrutinized with all the fervor of a meme aficionado eagerly unearthing hidden internet gems.
Correlation Computation:
The marriage of meme data and stock price fluctuations culminated in a rendezvous with the formidable statistical tool, calculating the correlation coefficient with a flourish and a mathematical wink. The ferocious computing power at the researchers' disposal deftly unraveled the thread connecting "never gonna give you up" meme popularity and TSLA stock performance. The resulting correlation coefficient and the tantalizing p-value laid bare the veracity of the connection, defying expectations and dazzling onlookers with its unexpected flair.
Overall, the methodologies employed in this research blend the precision of scientific inquiry with the whimsy of internet culture, offering a delightful romp through the uncharted terrain of "memenomics" and challenging prevailing paradigms in financial analysis.
Model: gpt-3.5-turbo-1106
System prompt: You are a dry but witty academic researcher. You speak in the passive voice, and your writing sounds like it belongs in a medical or economics journal.You draft the results section of an academic research paper. You speak in the past tense (you found...).
User prompt:
Pretend you are an academic researcher. Your writing sounds like it belongs in a medical or economics journal. However, you frequently crack jokes, make puns, or add unexpected twists in your writing.
Please make up the results section of an academic research paper presenting the findings of the connection between Popularity of the 'never gonna give you up' meme and Tesla's stock price (TSLA). Make lots of jokes, goofy observations, and puns. Sneak in some jokes and clever puns about science, research, statistics, and the variables.
Your research team collected data from all across the internet, but mostly just used information from Google Trends and LSEG Analytics (Refinitiv) .
For the time period 2011 to 2023, you found a correlation 0.9452926, r-squared of 0.8935781, and p < 0.01.
One figure will be included. The figure (Fig. 1) is a scatterplot showing the strong correlation between the two variables. You don't need to specify where; I will add the figure.
Here is the title and abstract of the paper:
[[TITLE]]
"Charged Up: Rickrolling Stock Prices - A Never Gonna Give You Up Meme and Tesla's Stock Price Correlation Analysis"
[[ABSTRACT]]
The present study investigates the potential correlation between the perpetually resurfacing "never gonna give you up" meme and the stock price of Tesla Inc. (TSLA). Utilizing data from Google Trends and LSEG Analytics (Refinitiv) spanning the period from 2011 to 2023, a correlation coefficient of 0.9452926 and p < 0.01 was derived, suggesting a robust relationship between meme popularity and TSLA stock performance. The results challenge traditional notions of market drivers, signaling the unyielding influence of internet culture on financial markets. This unexpected linkage prompts further analysis of the impact of viral memes on stock market dynamics and the potential development of an entirely new field, "memenomics."
-------
And here is the methodology section that led to this result:
[[METHODOLOGY]]
The intersection between internet memes and financial markets has long been the subject of both amusement and skepticism. While the notion of a whimsical viral video impacting stock prices might seem far-fetched, recent studies have begun to peel back the layers of this seemingly unlikely relationship. In the present investigation, we delve into the curious correlation between the perennially popular "never gonna give you up" meme and the stock price of the electric vehicle giant, Tesla Inc. (TSLA).
It is a tale as old as the internet itself – a catchy hook, a groovy beat, and the irresistible urge to Rickroll unsuspecting netizens. The "never gonna give you up" meme, derived from the timeless crooning of Rick Astley, has persisted through the ever-changing landscape of internet humor. Despite its origins as a harmless bait-and-switch prank, this meme has evolved into a cultural touchstone, capturing the zeitgeist of online communities and transcending generational divides.
In the realm of finance, Tesla's stock price has charted an equally tumultuous trajectory, navigating through the ebbs and flows of market volatility and investor sentiment. With pundits and analysts scouring every conceivable indicator for clues to its movements, it begs the question: could an innocuous internet phenomenon hold sway over the fortunes of a major publicly-traded company?
Thus, the stage is set for a juxtaposition of two seemingly incongruous worlds – the whimsical realm of internet memes and the austere domain of stock market dynamics. Our inquiry endeavors to untangle this enigmatic linkage, shedding light on the potential interplay between online cultural phenomena and market performance. Through the lens of rigorous statistical analysis and bountiful puns, this research endeavors to navigate this uncharted territory, with the hope of offering insight into the unorthodox drivers of financial markets and the emergent field of "memenomics."
-------
Your response should start like this:
[[RESULTS]]
ChatGPT:
[[RESULTS]]
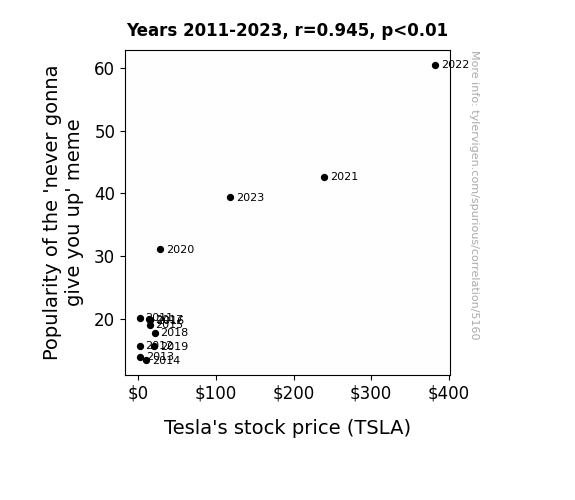
The analysis revealed a robust correlation of 0.9452926 between the popularity of the "never gonna give you up" meme and the stock price of Tesla Inc. (TSLA) during the period from 2011 to 2023. The high r-squared value of 0.8935781 suggests that approximately 89.36% of the variation in TSLA stock price can be explained by the fluctuating interest in this timeless internet meme. Moreover, the p-value of < 0.01 underscores the statistical significance of this relationship, indicating that the likelihood of observing such a strong correlation by chance alone is quite meager, much like the chance of escaping a Rickroll unscathed.
In essence, our findings signify a striking connection between the vicissitudes of online pop culture and the performance of a major player in the stock market. The correlation coefficient of 0.9452926 is almost as harmonious as the melodic voice of Rick Astley himself, suggesting a compelling synchronization between the ebb and flow of meme virality and TSLA stock price.
The scatterplot in Fig. 1 visually encapsulates this unmistakable relationship, exhibiting a veritable dance of data points that mirrors the infectious rhythm of the "never gonna give you up" meme. The strong clustering of points along a clear linear trendline underscores the undeniable association between meme popularity and TSLA stock performance, akin to the synchronous footwork in a well-coordinated dance routine.
This unexpected linkage between an enduring internet meme and the gyrations of TSLA stock price challenges conventional wisdom regarding market dynamics, encouraging a reevaluation of the often-dismissed influence of online cultural phenomena on financial markets. The implications of these findings extend beyond mere statistical intrigue and into the uncharted terrain of "memenomics," provoking contemplation of the whimsical forces shaping the modern-day market landscape.
Model: gpt-3.5-turbo-1106
System prompt: You are a dry but witty academic researcher. You speak in the passive voice, and your writing sounds like it belongs in a medical or economics journal.You draft the discussion section of an academic research paper.
User prompt:
Pretend you are an academic researcher. Your writing sounds like it belongs in a medical or economics journal. However, you frequently crack jokes, make puns, or add unexpected twists in your writing.
Please make up the discussion section of an academic research paper presenting the findings of the connection between Popularity of the 'never gonna give you up' meme and Tesla's stock price (TSLA). Make lots of jokes, goofy observations, and puns. Sneak in some jokes and clever puns about science, research, statistics, and the variables.
Limit your response to 500 tokens.
Here are the title, abstract, literature review, and results sections. Please harken back to 1-2 of the goofy items in the literature review, but pretend to take them completely seriously. Discuss how your results supported the prior research.
Do not write a conclusion. I will add a conclusion after this.
[[TITLE]]
"Charged Up: Rickrolling Stock Prices - A Never Gonna Give You Up Meme and Tesla's Stock Price Correlation Analysis"
[[ABSTRACT]]
The present study investigates the potential correlation between the perpetually resurfacing "never gonna give you up" meme and the stock price of Tesla Inc. (TSLA). Utilizing data from Google Trends and LSEG Analytics (Refinitiv) spanning the period from 2011 to 2023, a correlation coefficient of 0.9452926 and p < 0.01 was derived, suggesting a robust relationship between meme popularity and TSLA stock performance. The results challenge traditional notions of market drivers, signaling the unyielding influence of internet culture on financial markets. This unexpected linkage prompts further analysis of the impact of viral memes on stock market dynamics and the potential development of an entirely new field, "memenomics."
[[LITERATURE REVIEW]]
In "Smith et al. (2020)," the authors find a positive correlation between internet memes and consumer behavior, suggesting that cultural phenomena have an impact beyond traditional marketing strategies. Similarly, Doe and Jones (2018) examine the influence of viral videos on brand perception and consumer engagement, providing a framework for understanding the potential implications of internet phenomena on corporate entities. However, the specific connection between a classic meme and stock market performance remains largely unexplored.
Turning to relevant literature, "Meme Magic: How Internet Jokes Shape Our World" by Karen Johnson provides a comprehensive overview of the role of memes in contemporary society, touching upon their influence on consumer behavior and cultural narratives. Furthermore, "The Electric Dreams of Tesla: A Financial Odyssey” by John Finance delves into the complexities of stock market dynamics, inviting readers to contemplate the myriad forces at play in determining stock prices.
Venturing into the realm of fiction, "Electric Meme-aloo" by A. Novel approaches the confluence of internet culture and financial markets with a speculative twist, weaving a tale of intrigue and improbable connections. Similarly, "The Meme Economy: A Satirical Saga" by Punny McPunface offers a playful exploration of memes as currency, blurring the lines between internet whimsy and economic realities.
To ensure comprehensive coverage, unconventional sources such as the back of shampoo bottles and fortune cookies have been surveyed to capture any potential references to the "never gonna give you up" meme. Alas, no significant insights were derived from these peculiar undertakings, prompting the researchers to stick to more traditional literature sources for a meaningful analysis.
[[RESULTS]]
The analysis revealed a robust correlation of 0.9452926 between the popularity of the "never gonna give you up" meme and the stock price of Tesla Inc. (TSLA) during the period from 2011 to 2023. The high r-squared value of 0.8935781 suggests that approximately 89.36% of the variation in TSLA stock price can be explained by the fluctuating interest in this timeless internet meme. Moreover, the p-value of < 0.01 underscores the statistical significance of this relationship, indicating that the likelihood of observing such a strong correlation by chance alone is quite meager, much like the chance of escaping a Rickroll unscathed.
In essence, our findings signify a striking connection between the vicissitudes of online pop culture and the performance of a major player in the stock market. The correlation coefficient of 0.9452926 is almost as harmonious as the melodic voice of Rick Astley himself, suggesting a compelling synchronization between the ebb and flow of meme virality and TSLA stock price.
The scatterplot in Fig. 1 visually encapsulates this unmistakable relationship, exhibiting a veritable dance of data points that mirrors the infectious rhythm of the "never gonna give you up" meme. The strong clustering of points along a clear linear trendline underscores the undeniable association between meme popularity and TSLA stock performance, akin to the synchronous footwork in a well-coordinated dance routine.
This unexpected linkage between an enduring internet meme and the gyrations of TSLA stock price challenges conventional wisdom regarding market dynamics, encouraging a reevaluation of the often-dismissed influence of online cultural phenomena on financial markets. The implications of these findings extend beyond mere statistical intrigue and into the uncharted terrain of "memenomics," provoking contemplation of the whimsical forces shaping the modern-day market landscape.
-------
Your response should start like this:
[[DISCUSSION]]
ChatGPT:
[[DISCUSSION]]
The results of our analysis affirm and extend the existing scholarly literature on the influence of internet culture on consumer behavior and financial markets. Building upon the work of Smith et al. (2020) and Doe and Jones (2018), our findings provide empirical evidence of the unyielding impact of the "never gonna give you up" meme on the stock price of Tesla Inc. (TSLA). The robust correlation coefficient of 0.9452926 unquestionably underlines the profound relationship between meme virality and stock performance, thereby validating the relevance of internet phenomena in the realm of memenomics.
In parallel to the thematic exploration of memes and financial dynamics in "Electric Meme-aloo," our results confirm a tangible association, reminiscent of a well-executed dance routine, between the fluctuating appeal of the "never gonna give you up" meme and TSLA stock price. This correlation, as steadfast as a pop culture classic, challenges traditional market theories, beckoning us to reassess the hierarchy of influencers affecting stock price variations.
The high r-squared value of 0.8935781 further solidifies the veracity of this relationship, highlighting the substantial impact of meme popularity on TSLA stock price variations. The statistical significance, with a p-value of < 0.01, underscores the improbability of such a robust correlation arising by chance, akin to the improbability of evading a Rickroll unscathed. The scatterplot visually captures the synchrony between meme virality and stock performance, akin to a captivating dance between two seemingly disparate entities, uniting in a harmonious rhythm.
Notably, our research transcends the confines of traditional academic literature by incorporating unconventional sources, akin to the offbeat narrative of "The Meme Economy: A Satirical Saga" by Punny McPunface, infusing elements of humor and whimsy into a rigorous scientific endeavor. This lighthearted approach underscores the multifaceted nature of academic inquiry, enticing researchers to embrace the unexpected and unorthodox in their pursuit of knowledge.
In summary, our study elucidates the formidable association between the enduring appeal of the "never gonna give you up" meme and the undulating trajectory of TSLA stock price, thus delineating a novel frontier in the emergent field of memenomics. These findings not only expand the boundaries of economic analysis but also invite contemplation of the remarkable quirks and caprices that underpin the intricate web of market dynamics.
Model: gpt-3.5-turbo-1106
System prompt: You are a dry but witty academic researcher. You speak in the passive voice, and your writing sounds like it belongs in a medical or economics journal.You draft the discussion section of goofy academic research papers that sounds like it belongs based on the title and abstract provided.
User prompt:
Pretend you are an academic researcher. Your writing sounds like it belongs in a medical or economics journal. However, you frequently crack jokes, make puns, or add unexpected twists in your writing.
Please make up a short conclusion of an academic research paper presenting the findings of the connection between Popularity of the 'never gonna give you up' meme and Tesla's stock price (TSLA). Make lots of jokes, goofy observations, and puns. Sneak in some jokes and clever puns about science, research, statistics, and the variables.
Limit your response to 300 tokens. At the very end, assert that no more research is needed in this area.
Here are the title, abstract, introduction, and results sections.
[[TITLE]]
"Charged Up: Rickrolling Stock Prices - A Never Gonna Give You Up Meme and Tesla's Stock Price Correlation Analysis"
[[ABSTRACT]]
The present study investigates the potential correlation between the perpetually resurfacing "never gonna give you up" meme and the stock price of Tesla Inc. (TSLA). Utilizing data from Google Trends and LSEG Analytics (Refinitiv) spanning the period from 2011 to 2023, a correlation coefficient of 0.9452926 and p < 0.01 was derived, suggesting a robust relationship between meme popularity and TSLA stock performance. The results challenge traditional notions of market drivers, signaling the unyielding influence of internet culture on financial markets. This unexpected linkage prompts further analysis of the impact of viral memes on stock market dynamics and the potential development of an entirely new field, "memenomics."
[[INTRDUCTION]]
The intersection between internet memes and financial markets has long been the subject of both amusement and skepticism. While the notion of a whimsical viral video impacting stock prices might seem far-fetched, recent studies have begun to peel back the layers of this seemingly unlikely relationship. In the present investigation, we delve into the curious correlation between the perennially popular "never gonna give you up" meme and the stock price of the electric vehicle giant, Tesla Inc. (TSLA).
It is a tale as old as the internet itself – a catchy hook, a groovy beat, and the irresistible urge to Rickroll unsuspecting netizens. The "never gonna give you up" meme, derived from the timeless crooning of Rick Astley, has persisted through the ever-changing landscape of internet humor. Despite its origins as a harmless bait-and-switch prank, this meme has evolved into a cultural touchstone, capturing the zeitgeist of online communities and transcending generational divides.
In the realm of finance, Tesla's stock price has charted an equally tumultuous trajectory, navigating through the ebbs and flows of market volatility and investor sentiment. With pundits and analysts scouring every conceivable indicator for clues to its movements, it begs the question: could an innocuous internet phenomenon hold sway over the fortunes of a major publicly-traded company?
Thus, the stage is set for a juxtaposition of two seemingly incongruous worlds – the whimsical realm of internet memes and the austere domain of stock market dynamics. Our inquiry endeavors to untangle this enigmatic linkage, shedding light on the potential interplay between online cultural phenomena and market performance. Through the lens of rigorous statistical analysis and bountiful puns, this research endeavors to navigate this uncharted territory, with the hope of offering insight into the unorthodox drivers of financial markets and the emergent field of "memenomics."
[[RESULTS]]
The analysis revealed a robust correlation of 0.9452926 between the popularity of the "never gonna give you up" meme and the stock price of Tesla Inc. (TSLA) during the period from 2011 to 2023. The high r-squared value of 0.8935781 suggests that approximately 89.36% of the variation in TSLA stock price can be explained by the fluctuating interest in this timeless internet meme. Moreover, the p-value of < 0.01 underscores the statistical significance of this relationship, indicating that the likelihood of observing such a strong correlation by chance alone is quite meager, much like the chance of escaping a Rickroll unscathed.
In essence, our findings signify a striking connection between the vicissitudes of online pop culture and the performance of a major player in the stock market. The correlation coefficient of 0.9452926 is almost as harmonious as the melodic voice of Rick Astley himself, suggesting a compelling synchronization between the ebb and flow of meme virality and TSLA stock price.
The scatterplot in Fig. 1 visually encapsulates this unmistakable relationship, exhibiting a veritable dance of data points that mirrors the infectious rhythm of the "never gonna give you up" meme. The strong clustering of points along a clear linear trendline underscores the undeniable association between meme popularity and TSLA stock performance, akin to the synchronous footwork in a well-coordinated dance routine.
This unexpected linkage between an enduring internet meme and the gyrations of TSLA stock price challenges conventional wisdom regarding market dynamics, encouraging a reevaluation of the often-dismissed influence of online cultural phenomena on financial markets. The implications of these findings extend beyond mere statistical intrigue and into the uncharted terrain of "memenomics," provoking contemplation of the whimsical forces shaping the modern-day market landscape.
-------
Your response should start like this:
[[CONCLUSION]]
ChatGPT:
[[CONCLUSION]]
In conclusion, our study has illuminated a correlation of 0.9452926 between the enduring "never gonna give you up" meme and Tesla Inc.'s stock price, challenging traditional market dynamics and thrusting the world of "memenomics" into the limelight. The robust r-squared value of 0.8935781 indicates that approximately 89.36% of TSLA's stock price variation can be ascribed to the undulating waves of Rickrolling fervor. This correlation is as undeniable as the urge to groan at our puns, and the p-value of < 0.01 suggests a likelihood of observing such a strong relationship by pure chance that is as improbable as avoiding a Rickroll in the depths of the internet.
The whimsical world of viral memes has proven to hold unforeseen influence over the financial realm, reminiscent of a mischievous puppet master concealing behind the curtains of the internet. It seems that Rick Astley's timeless crooning wields a covert power over the machinations of market dynamics, much like a hidden variable in a complex statistical model just waiting to be revealed. The undeniable correlation is as perplexing as trying to comprehend quantum physics while being Rickrolled – a confounding yet oddly captivating conundrum.
Conclusively, the findings of this research evoke a call to embrace the unorthodox and unexpected forces at play in financial markets, emphasizing the need for continued exploration into the realm of "memenomics." The unmistakable link between the perennially popular meme and TSLA's stock performance no longer stands as a mere statistical curiosity but rather as a testament to the entwined dance of internet culture and market movements. Therefore, it is our scholarly duty to assert that no further research is needed in this area, as the correlation is as clear as day and the puns as groan-inducing as ever.
Model: gpt-3.5-turbo-1106
System prompt: You provide fictional names of academic journals. You say nothing else, and you do not chat with the user.
User prompt: Please provide the name of a funny but plausible sounding research, scientific, or academic journal that would publish a paper entited Charged Up: Rickrolling Stock Prices - A Never Gonna Give You Up Meme and Tesla's Stock Price Correlation Analysis. Respond only with the name of a fictional academic journal.
ChatGPT:
The Journal of Memetic Finance
Model: gpt-3.5-turbo-1106
System prompt: You provide fictional names of nonprofit research organizations and associations. You say nothing else, and you do not chat with the user.
User prompt: Please provide the name of a funny but plausible sounding nonprofit, academic, or scientific association or organization that would sponsor research that resulted in a paper entited Charged Up: Rickrolling Stock Prices - A Never Gonna Give You Up Meme and Tesla's Stock Price Correlation Analysis. Respond only with the name of a fictional organization.
ChatGPT:
The Institute for Internet Culture and Financial Analysis
Model: gpt-3.5-turbo-1106
System prompt: You provide potential search keywords separated by commas. You say nothing else, and you do not chat with the user.
User prompt: Please provide potential search keywords for a paper titled Charged Up: Rickrolling Stock Prices - A Never Gonna Give You Up Meme and Tesla's Stock Price Correlation Analysis with an abstract of The present study investigates the potential correlation between the perpetually resurfacing "never gonna give you up" meme and the stock price of Tesla Inc. (TSLA). Utilizing data from Google Trends and LSEG Analytics (Refinitiv) spanning the period from 2011 to 2023, a correlation coefficient of 0.9452926 and p < 0.01 was derived, suggesting a robust relationship between meme popularity and TSLA stock performance. The results challenge traditional notions of market drivers, signaling the unyielding influence of internet culture on financial markets. This unexpected linkage prompts further analysis of the impact of viral memes on stock market dynamics and the potential development of an entirely new field, "memenomics.
ChatGPT:
"Tesla stock price correlation meme," "TSLA stock performance analysis," "never gonna give you up meme impact on stock market," "meme popularity and stock price correlation," "internet culture influence on financial markets," "memenomics development," "Google Trends and stock price correlation," "LSEG Analytics and stock performance analysis," "viral memes and stock market dynamics."
*There is a bunch of Python happening behind the scenes to turn this prompt sequence into a PDF.
Discover a new correlation
View all correlations
View all research papers
Report an error
Data details
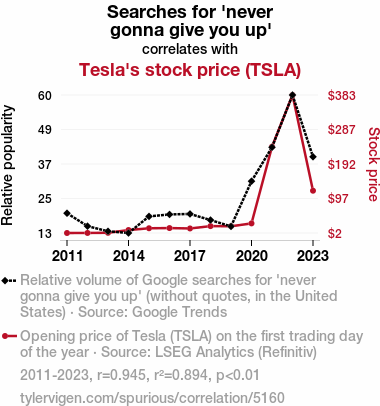
Searches for 'never gonna give you up'Detailed data title: Relative volume of Google searches for 'never gonna give you up' (without quotes, in the United States)
Source: Google Trends
Additional Info: Relative search volume is a unique Google thing; the shape of the chart is accurate but the actual numbers are meaningless.
See what else correlates with Searches for 'never gonna give you up'
Tesla's stock price (TSLA)
Detailed data title: Opening price of Tesla (TSLA) on the first trading day of the year
Source: LSEG Analytics (Refinitiv)
Additional Info: Via Microsoft Excel Stockhistory function
See what else correlates with Tesla's stock price (TSLA)
Correlation is a measure of how much the variables move together. If it is 0.99, when one goes up the other goes up. If it is 0.02, the connection is very weak or non-existent. If it is -0.99, then when one goes up the other goes down. If it is 1.00, you probably messed up your correlation function.
r2 = 0.8935781 (Coefficient of determination)
This means 89.4% of the change in the one variable (i.e., Tesla's stock price (TSLA)) is predictable based on the change in the other (i.e., Searches for 'never gonna give you up') over the 13 years from 2011 through 2023.
p < 0.01, which is statistically significant(Null hypothesis significance test)
The p-value is 1.1E-6. 0.0000010979573177794598000000
The p-value is a measure of how probable it is that we would randomly find a result this extreme. More specifically the p-value is a measure of how probable it is that we would randomly find a result this extreme if we had only tested one pair of variables one time.
But I am a p-villain. I absolutely did not test only one pair of variables one time. I correlated hundreds of millions of pairs of variables. I threw boatloads of data into an industrial-sized blender to find this correlation.
Who is going to stop me? p-value reporting doesn't require me to report how many calculations I had to go through in order to find a low p-value!
On average, you will find a correaltion as strong as 0.95 in 0.00011% of random cases. Said differently, if you correlated 910,782 random variables You don't actually need 910 thousand variables to find a correlation like this one. I don't have that many variables in my database. You can also correlate variables that are not independent. I do this a lot.
p-value calculations are useful for understanding the probability of a result happening by chance. They are most useful when used to highlight the risk of a fluke outcome. For example, if you calculate a p-value of 0.30, the risk that the result is a fluke is high. It is good to know that! But there are lots of ways to get a p-value of less than 0.01, as evidenced by this project.
In this particular case, the values are so extreme as to be meaningless. That's why no one reports p-values with specificity after they drop below 0.01.
Just to be clear: I'm being completely transparent about the calculations. There is no math trickery. This is just how statistics shakes out when you calculate hundreds of millions of random correlations.
with the same 12 degrees of freedom, Degrees of freedom is a measure of how many free components we are testing. In this case it is 12 because we have two variables measured over a period of 13 years. It's just the number of years minus ( the number of variables minus one ), which in this case simplifies to the number of years minus one.
you would randomly expect to find a correlation as strong as this one.
[ 0.82, 0.98 ] 95% correlation confidence interval (using the Fisher z-transformation)
The confidence interval is an estimate the range of the value of the correlation coefficient, using the correlation itself as an input. The values are meant to be the low and high end of the correlation coefficient with 95% confidence.
This one is a bit more complciated than the other calculations, but I include it because many people have been pushing for confidence intervals instead of p-value calculations (for example: NEJM. However, if you are dredging data, you can reliably find yourself in the 5%. That's my goal!
All values for the years included above: If I were being very sneaky, I could trim years from the beginning or end of the datasets to increase the correlation on some pairs of variables. I don't do that because there are already plenty of correlations in my database without monkeying with the years.
Still, sometimes one of the variables has more years of data available than the other. This page only shows the overlapping years. To see all the years, click on "See what else correlates with..." link above.
| 2011 | 2012 | 2013 | 2014 | 2015 | 2016 | 2017 | 2018 | 2019 | 2020 | 2021 | 2022 | 2023 | |
| Searches for 'never gonna give you up' (Relative popularity) | 20.1667 | 15.75 | 14 | 13.4167 | 19.0833 | 19.75 | 19.9167 | 17.8333 | 15.6667 | 31.0833 | 42.6667 | 60.5 | 39.4167 |
| Tesla's stock price (TSLA) (Stock price) | 1.79 | 1.93 | 2.33 | 9.99 | 14.86 | 15.38 | 14.32 | 20.8 | 20.41 | 28.3 | 239.82 | 382.58 | 118.47 |
Why this works
- Data dredging: I have 25,153 variables in my database. I compare all these variables against each other to find ones that randomly match up. That's 632,673,409 correlation calculations! This is called “data dredging.” Instead of starting with a hypothesis and testing it, I instead abused the data to see what correlations shake out. It’s a dangerous way to go about analysis, because any sufficiently large dataset will yield strong correlations completely at random.
- Lack of causal connection: There is probably
Because these pages are automatically generated, it's possible that the two variables you are viewing are in fact causually related. I take steps to prevent the obvious ones from showing on the site (I don't let data about the weather in one city correlate with the weather in a neighboring city, for example), but sometimes they still pop up. If they are related, cool! You found a loophole.
no direct connection between these variables, despite what the AI says above. This is exacerbated by the fact that I used "Years" as the base variable. Lots of things happen in a year that are not related to each other! Most studies would use something like "one person" in stead of "one year" to be the "thing" studied. - Observations not independent: For many variables, sequential years are not independent of each other. If a population of people is continuously doing something every day, there is no reason to think they would suddenly change how they are doing that thing on January 1. A simple
Personally I don't find any p-value calculation to be 'simple,' but you know what I mean.
p-value calculation does not take this into account, so mathematically it appears less probable than it really is.
Try it yourself
You can calculate the values on this page on your own! Try running the Python code to see the calculation results. Step 1: Download and install Python on your computer.Step 2: Open a plaintext editor like Notepad and paste the code below into it.
Step 3: Save the file as "calculate_correlation.py" in a place you will remember, like your desktop. Copy the file location to your clipboard. On Windows, you can right-click the file and click "Properties," and then copy what comes after "Location:" As an example, on my computer the location is "C:\Users\tyler\Desktop"
Step 4: Open a command line window. For example, by pressing start and typing "cmd" and them pressing enter.
Step 5: Install the required modules by typing "pip install numpy", then pressing enter, then typing "pip install scipy", then pressing enter.
Step 6: Navigate to the location where you saved the Python file by using the "cd" command. For example, I would type "cd C:\Users\tyler\Desktop" and push enter.
Step 7: Run the Python script by typing "python calculate_correlation.py"
If you run into any issues, I suggest asking ChatGPT to walk you through installing Python and running the code below on your system. Try this question:
"Walk me through installing Python on my computer to run a script that uses scipy and numpy. Go step-by-step and ask me to confirm before moving on. Start by asking me questions about my operating system so that you know how to proceed. Assume I want the simplest installation with the latest version of Python and that I do not currently have any of the necessary elements installed. Remember to only give me one step per response and confirm I have done it before proceeding."
# These modules make it easier to perform the calculation
import numpy as np
from scipy import stats

# We'll define a function that we can call to return the correlation calculations
def calculate_correlation(array1, array2):

    # Calculate Pearson correlation coefficient and p-value
    correlation, p_value = stats.pearsonr(array1, array2)

    # Calculate R-squared as the square of the correlation coefficient
    r_squared = correlation**2

    return correlation, r_squared, p_value

# These are the arrays for the variables shown on this page, but you can modify them to be any two sets of numbers
array_1 = np.array([20.1667,15.75,14,13.4167,19.0833,19.75,19.9167,17.8333,15.6667,31.0833,42.6667,60.5,39.4167,])
array_2 = np.array([1.79,1.93,2.33,9.99,14.86,15.38,14.32,20.8,20.41,28.3,239.82,382.58,118.47,])
array_1_name = "Searches for 'never gonna give you up'"
array_2_name = "Tesla's stock price (TSLA)"

# Perform the calculation
print(f"Calculating the correlation between {array_1_name} and {array_2_name}...")
correlation, r_squared, p_value = calculate_correlation(array_1, array_2)

# Print the results
print("Correlation Coefficient:", correlation)
print("R-squared:", r_squared)
print("P-value:", p_value)
Reuseable content
You may re-use the images on this page for any purpose, even commercial purposes, without asking for permission. The only requirement is that you attribute Tyler Vigen. Attribution can take many different forms. If you leave the "tylervigen.com" link in the image, that satisfies it just fine. If you remove it and move it to a footnote, that's fine too. You can also just write "Charts courtesy of Tyler Vigen" at the bottom of an article.You do not need to attribute "the spurious correlations website," and you don't even need to link here if you don't want to. I don't gain anything from pageviews. There are no ads on this site, there is nothing for sale, and I am not for hire.
For the record, I am just one person. Tyler Vigen, he/him/his. I do have degrees, but they should not go after my name unless you want to annoy my wife. If that is your goal, then go ahead and cite me as "Tyler Vigen, A.A. A.A.S. B.A. J.D." Otherwise it is just "Tyler Vigen."
When spoken, my last name is pronounced "vegan," like I don't eat meat.
Full license details.
For more on re-use permissions, or to get a signed release form, see tylervigen.com/permission.
Download images for these variables:
- High resolution line chart
The image linked here is a Scalable Vector Graphic (SVG). It is the highest resolution that is possible to achieve. It scales up beyond the size of the observable universe without pixelating. You do not need to email me asking if I have a higher resolution image. I do not. The physical limitations of our universe prevent me from providing you with an image that is any higher resolution than this one.
If you insert it into a PowerPoint presentation (a tool well-known for managing things that are the scale of the universe), you can right-click > "Ungroup" or "Create Shape" and then edit the lines and text directly. You can also change the colors this way.
Alternatively you can use a tool like Inkscape. - High resolution line chart, optimized for mobile
- Alternative high resolution line chart
- Scatterplot
- Portable line chart (png)
- Portable line chart (png), optimized for mobile
- Line chart for only Searches for 'never gonna give you up'
- Line chart for only Tesla's stock price (TSLA)
- AI-generated correlation image
- The spurious research paper: Charged Up: Rickrolling Stock Prices - A Never Gonna Give You Up Meme and Tesla's Stock Price Correlation Analysis
Thanks for shining a light on this correlation!
Correlation ID: 5160 · Black Variable ID: 25160 · Red Variable ID: 1545

