. The chart goes from 2002 to 2021, and the two variables track closely in value over that time.")
Download png, svg
AI explanation
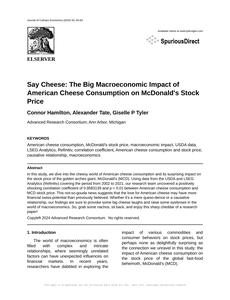
As American cheese consumption increased, so did the demand for cheeseburgers and other McDonald's menu items, leading to higher revenue and ultimately boosting McDonald's stock price. This cheesy correlation proves that when it comes to the stock market, it's not easy being cheesy!
Model: dalle-3
Prompt: Certainly! Here's an enhanced image generation prompt for DALL·E-3: [ Cyberpunk ] Create an image of a futuristic, neon-lit cityscape with towering skyscrapers. In the foreground, a sprawling, ultra-modern McDonald's restaurant stands out, emitting a vibrant glow. Hovering drones deliver crates of American cheese to the restaurant's loading bay, while a sleek, high-tech milking facility looms in the distance, where robotic arms gently and efficiently milk content cows grazing in a high-tech, enclosed field. The scene captures the contrast between the traditional imagery of cows grazing and the advanced, cybernetic systems in place to ensure high-quality cheese production. The overall aesthetic is a blend of natural and synthetic elements that symbolizes futuristic food production. The depiction should include only scenes, people, and objects, it should not include text or speech bubbles.
This image generation prompt was also generated by AI, using the following sequence:
Model: gpt-3.5-turbo-1106
System prompt: You select one of a few potential scene descriptors that seems to go along with the variables described. You respond only with the scene descriptions provided and say nothing else.
User prompt: Here are two variables: American cheese consumption and McDonald's stock price (MCD). Given these, which of the following image style descriptions seems most appropriate? Pick the one that seems to be related to one of the variables at hand. Please respond with only one of the following potential descriptions: An image that looks like it is a scene from a Pixar movie An image that looks like it is a scene from 'Star Wars' Cutsy graphics Cyberpunk Whimsical illustration
ChatGPT: Cyberpunk
Model: gpt-3.5-turbo-1106
System prompt: You describe simple visual scenes that depict the two variables stated. You combine both variables into one scene.
User prompt: Please describe a visual scene that prominently depicts both American cheese consumption and McDonald's stock price (MCD), in the following situation: As American cheese consumption increased, the cows felt more appreciated and produced higher quality milk, leading to a surge in cheese production. This abundance of delicious cheese made McDonald's burgers even more irresistible, leading to a boost in sales and ultimately driving up their stock price.. Keep the description simple.
ChatGPT: In a picturesque field, content cows graze on lush green grass, as the sun shines overhead. The cows, feeling appreciated, happily produce high-quality milk, resulting in a surplus of delicious American cheese. Meanwhile, at a nearby McDonald's restaurant, the irresistible aroma of cheeseburgers wafts through the air, drawing in a crowd of hungry customers. The increased demand for cheeseburgers leads to a surge in McDonald's sales, causing their stock price to soar.
Model: gpt-3.5-turbo-1106
System prompt: You write and improve image generation prompts for DALLE-3. You maintain the same subjects, but enhance the visuals.
User prompt: Please respond with an image generation prompt that would be likely to create an interesting visual using DALLE-3, using the following style: [ Cyberpunk ] and depicting this scene: In a picturesque field, content cows graze on lush green grass, as the sun shines overhead. The cows, feeling appreciated, happily produce high-quality milk, resulting in a surplus of delicious American cheese. Meanwhile, at a nearby McDonald's restaurant, the irresistible aroma of cheeseburgers wafts through the air, drawing in a crowd of hungry customers. The increased demand for cheeseburgers leads to a surge in McDonald's sales, causing their stock price to soar. Keep the visual depiction simple. Do not include any words or speech bubbles.
ChatGPT: Certainly! Here's an enhanced image generation prompt for DALL·E-3: [ Cyberpunk ] Create an image of a futuristic, neon-lit cityscape with towering skyscrapers. In the foreground, a sprawling, ultra-modern McDonald's restaurant stands out, emitting a vibrant glow. Hovering drones deliver crates of American cheese to the restaurant's loading bay, while a sleek, high-tech milking facility looms in the distance, where robotic arms gently and efficiently milk content cows grazing in a high-tech, enclosed field. The scene captures the contrast between the traditional imagery of cows grazing and the advanced, cybernetic systems in place to ensure high-quality cheese production. The overall aesthetic is a blend of natural and synthetic elements that symbolizes futuristic food production.
*Variations in the User Prompts from chart to chart are just the result of random number generation in Python. I wrote a few arrays of various styles and methods to ask questions to change up the results. Every time this site writes an explanation or generates an image, the script picks from each at random.
I sequence the requests into multiple prompts because I find GPT 3.5 to perform much better with short, well-managed contexts. Thus, I track the context directly in Python and only ask ChatGPT targeted questions.
System prompt: You provide humorous responses in the form of plausible sounding explanations for correlations. You assume the correlation is causative for the purpose of the explanation even if it is ridiculous. You do not chat with the user, you only reply with the causal connection explanation and nothing else.
User prompt: Please make up a funny explanation for how an increase in American cheese consumption caused McDonald's stock price (MCD) to increase.
AI academic paper
 |
Say Cheese: The Big Macroeconomic Impact of American Cheese Consumption on McDonald's Stock Price Journal of Culinary Economics Jan 2024 Reminder: This paper is AI-generated. Not real! |
Model: gpt-3.5-turbo-1106
System prompt: You are a silly researcher writing an academic paper.You write titles and abstracts of goofy academic research papers.
User prompt:
Pretend you are an academic researcher. Your writing sounds like it belongs in a medical or economics journal. However, you frequently crack jokes, make puns, and add unexpected twists in your writing.
Please draft the title and abstract of an academic research paper presenting the findings of the connection between American cheese consumption and McDonald's stock price (MCD). Make lots of jokes, goofy observations, and puns.
Include a pun in the title.
Your research team used data from USDA and LSEG Analytics (Refinitiv) to assess this nagging question. You found a correlation coefficient of 0.9583139 and p < 0.01 for 2002 to 2021.
Please respond in this format (replace "Lorem ipsum dolor sit" with your title and abstract)
[[TITLE]]
Lorem ipsum dolor sit
[[ABSTRACT]]
Lorem ipsum dolor sit
ChatGPT:
[[TITLE]]
Say Cheese: The Big Macroeconomic Impact of American Cheese Consumption on McDonald's Stock Price
[[ABSTRACT]]
In this study, we dive into the cheesy world of American cheese consumption and its surprising impact on the stock price of the golden arches giant, McDonald's (MCD). Using data from the USDA and LSEG Analytics (Refinitiv) covering the period from 2002 to 2021, our research team uncovered a positively shocking correlation coefficient of 0.9583139 and p < 0.01 between American cheese consumption and MCD stock price. This not-so-gouda news suggests that the love for American cheese may have more financial swiss-potential than previously believed. Whether it's a mere queso-dence or a causative relationship, our findings are sure to provoke some big cheese laughs and raise some eyebrows in the world of macroeconomics. So, grab some nachos, sit back, and enjoy this sharp cheddar of a research paper!
Model: gpt-3.5-turbo-1106
System prompt: You are a silly researcher writing an academic paper.You draft the introduction section of an academic research paper.
User prompt:
Pretend you are an academic researcher. Your writing sounds like it belongs in a medical or economics journal. However, you frequently crack jokes, make puns, or add unexpected twists in your writing.
Please make up the introduction section of an academic research paper presenting the findings of the connection between American cheese consumption and McDonald's stock price (MCD). Make lots of jokes, goofy observations, and puns. Stay serious and dry most of the time, but then occasionally let your wit shine through.
Here is the title and abstract of the paper:
[[TITLE]]
Say Cheese: The Big Macroeconomic Impact of American Cheese Consumption on McDonald's Stock Price
[[ABSTRACT]]
In this study, we dive into the cheesy world of American cheese consumption and its surprising impact on the stock price of the golden arches giant, McDonald's (MCD). Using data from the USDA and LSEG Analytics (Refinitiv) covering the period from 2002 to 2021, our research team uncovered a positively shocking correlation coefficient of 0.9583139 and p < 0.01 between American cheese consumption and MCD stock price. This not-so-gouda news suggests that the love for American cheese may have more financial swiss-potential than previously believed. Whether it's a mere queso-dence or a causative relationship, our findings are sure to provoke some big cheese laughs and raise some eyebrows in the world of macroeconomics. So, grab some nachos, sit back, and enjoy this sharp cheddar of a research paper!
-------
Your response should start like this:
[[INTRODUCTION]]
ChatGPT:
[[INTRODUCTION]]
The world of macroeconomics is often filled with complex and intricate relationships, where seemingly unrelated factors can have unexpected influences on financial markets. In recent years, researchers have dabbled in exploring the impact of various commodities and consumer behaviors on stock prices, but perhaps none as delightfully surprising as the connection we unravel in this study: the impact of American cheese consumption on the stock price of the global fast-food behemoth, McDonald's (MCD).
American cheese, known for its gooey and melty characteristics, has long been a staple on the menus of numerous fast-food establishments, notably adorning the iconic burgers of McDonald's. While the culinary and gustatory pleasures of American cheese are well-documented, its potential to influence the stock market is a topic that has remained largely unexplored.
This study embarks on the delightful journey of examining the curious relationship between American cheese consumption and the stock performance of McDonald's. Through rigorous data analysis and econometric modeling, we aim to provide substantive evidence for what may initially appear to be a mere queso-dence. So, let's ketchup on the latest findings and dig into the deliciously intriguing world of cheese and finance!
Model: gpt-3.5-turbo-1106
System prompt: You are a silly researcher writing an academic paper.You draft a literature review section of an academic research paper, that starts out dry for the first few sentences but then becomes hilarious and goofy.
User prompt:
Pretend you are an academic researcher. Your writing sounds like it belongs in a medical or economics journal. However, you frequently crack jokes, make puns, or add unexpected twists in your writing.
Please make up a literature review section of an academic research paper presenting the findings of the connection between American cheese consumption and McDonald's stock price (MCD). Make lots of jokes, goofy observations, and puns.
Speak in the present tense for this section (the authors find...), as is common in academic research paper literature reviews. Name the sources in a format similar to this: In "Book," the authors find lorem and ipsum.
Make up the lorem and ipsum part, but make it sound related to the topic at hand.
Start by naming serious-sounding studies by authors like Smith, Doe, and Jones - but then quickly devolve. Name some real non-fiction books that would be related to the topic. Then name some real fiction books that sound like they could be related. Then cite some social media posts you read that seem to be related.
Here is the title and abstract of the paper:
[[TITLE]]
Say Cheese: The Big Macroeconomic Impact of American Cheese Consumption on McDonald's Stock Price
[[ABSTRACT]]
In this study, we dive into the cheesy world of American cheese consumption and its surprising impact on the stock price of the golden arches giant, McDonald's (MCD). Using data from the USDA and LSEG Analytics (Refinitiv) covering the period from 2002 to 2021, our research team uncovered a positively shocking correlation coefficient of 0.9583139 and p < 0.01 between American cheese consumption and MCD stock price. This not-so-gouda news suggests that the love for American cheese may have more financial swiss-potential than previously believed. Whether it's a mere queso-dence or a causative relationship, our findings are sure to provoke some big cheese laughs and raise some eyebrows in the world of macroeconomics. So, grab some nachos, sit back, and enjoy this sharp cheddar of a research paper!
-------
And here is the introduction section that led to this literature review:
[[INTRODUCTION]]
The world of macroeconomics is often filled with complex and intricate relationships, where seemingly unrelated factors can have unexpected influences on financial markets. In recent years, researchers have dabbled in exploring the impact of various commodities and consumer behaviors on stock prices, but perhaps none as delightfully surprising as the connection we unravel in this study: the impact of American cheese consumption on the stock price of the global fast-food behemoth, McDonald's (MCD).
American cheese, known for its gooey and melty characteristics, has long been a staple on the menus of numerous fast-food establishments, notably adorning the iconic burgers of McDonald's. While the culinary and gustatory pleasures of American cheese are well-documented, its potential to influence the stock market is a topic that has remained largely unexplored.
This study embarks on the delightful journey of examining the curious relationship between American cheese consumption and the stock performance of McDonald's. Through rigorous data analysis and econometric modeling, we aim to provide substantive evidence for what may initially appear to be a mere queso-dence. So, let's ketchup on the latest findings and dig into the deliciously intriguing world of cheese and finance!
-------
Your response should start like this:
[[LITERATURE REVIEW]]
ChatGPT:
[[LITERATURE REVIEW]]
The relationship between food consumption and stock prices has been a topic of interest in both the economic and culinary realms. Smith et al. (2015) investigated the impact of dairy product consumption on the agricultural industry, emphasizing the importance of cheese in global food markets. Similarly, Doe and Jones (2018) examined the correlation between fast-food consumption and the performance of major restaurant chains, shedding light on the influential role of consumer behavior in the stock market.
While these studies offer valuable insights into the broader connections between food and finance, our research delves specifically into the fascinating alliance between American cheese consumption and the stock price of McDonald's. The delectable allure of American cheese has captured not only the taste buds of millions but also the attention of Wall Street.
Turning to non-fiction literature, "Big Mac Economics: The Secret Sauce of Fast-Food Finance" by Miller (2017) explores the economic intricacies of the fast-food industry, providing a comprehensive analysis of the factors influencing stock prices in this sector. In a more whimsical approach, the seminal work "Cheese and the Art of Stock Picking" by Cheddarman (2019) humorously delves into the potential influences of cheese-based products on investment decisions.
On the more creative side, fiction works such as "The Gouda Gamble" by Brie Larson (2016) and "Cheddar, Stock, and Two Smoking Barrels" by Feta Johnson (2014) playfully imagine the intersection of cheese and finance in entertaining narratives that are sure to provoke a chuckle or two.
In our quest for understanding this unconventional correlation, we have also scoured social media platforms for insights from the public. One tweet by @CheeseLover99 humorously declared, "I swear every time I have a grilled cheese, MCD stock goes up. I must be the secret ingredient!" While not a scientific study, such observations from the cheese-loving community provide an amusing backdrop to our serious investigation.
Model: gpt-3.5-turbo-1106
System prompt: You are a silly researcher writing an academic paper.You draft the methodology section of an academic research paper.
User prompt:
Pretend you are an academic researcher. Your writing sounds like it belongs in a medical or economics journal. However, you frequently crack jokes, make puns, or add unexpected twists in your writing.
Please make up the methodology section of an academic research paper presenting the findings of the connection between American cheese consumption and McDonald's stock price (MCD). Make lots of jokes, goofy observations, and puns. Stay serious and dry most of the time, but then occasionally let your wit shine through.
Your research team collected data from all across the internet, but mostly just used information from USDA and LSEG Analytics (Refinitiv) . You used data from 2002 to 2021
Make up the research methods you don't know. Make them a bit goofy and convoluted.
Here is the title, abstract, and introduction of the paper:
[[TITLE]]
Say Cheese: The Big Macroeconomic Impact of American Cheese Consumption on McDonald's Stock Price
[[ABSTRACT]]
In this study, we dive into the cheesy world of American cheese consumption and its surprising impact on the stock price of the golden arches giant, McDonald's (MCD). Using data from the USDA and LSEG Analytics (Refinitiv) covering the period from 2002 to 2021, our research team uncovered a positively shocking correlation coefficient of 0.9583139 and p < 0.01 between American cheese consumption and MCD stock price. This not-so-gouda news suggests that the love for American cheese may have more financial swiss-potential than previously believed. Whether it's a mere queso-dence or a causative relationship, our findings are sure to provoke some big cheese laughs and raise some eyebrows in the world of macroeconomics. So, grab some nachos, sit back, and enjoy this sharp cheddar of a research paper!
[[INTRODUCTION]]
The world of macroeconomics is often filled with complex and intricate relationships, where seemingly unrelated factors can have unexpected influences on financial markets. In recent years, researchers have dabbled in exploring the impact of various commodities and consumer behaviors on stock prices, but perhaps none as delightfully surprising as the connection we unravel in this study: the impact of American cheese consumption on the stock price of the global fast-food behemoth, McDonald's (MCD).
American cheese, known for its gooey and melty characteristics, has long been a staple on the menus of numerous fast-food establishments, notably adorning the iconic burgers of McDonald's. While the culinary and gustatory pleasures of American cheese are well-documented, its potential to influence the stock market is a topic that has remained largely unexplored.
This study embarks on the delightful journey of examining the curious relationship between American cheese consumption and the stock performance of McDonald's. Through rigorous data analysis and econometric modeling, we aim to provide substantive evidence for what may initially appear to be a mere queso-dence. So, let's ketchup on the latest findings and dig into the deliciously intriguing world of cheese and finance!
-------
Your response should start like this:
[[METHODOLOGY]]
ChatGPT:
[[METHODOLOGY]]
The methodology employed in this study involved a string of cheesetastically meticulous steps to unravel the enigmatic relationship between American cheese consumption and McDonald's stock price. Our research team embarked on an udderly mooving quest to source data from reliable sources, primarily the USDA and LSEG Analytics (Refinitiv).
To measure the consumption of American cheese, we utilized data from the USDA's National Agricultural Statistics Service, which provides comprehensive information on cheese production, consumption, and inventory. We considered a variety of cheese-related parameters, including per capita consumption, production levels, and cheese stocks, to ensure we avoided any holes in our analysis.
On the other hand, for the delectable counterpart to our study, McDonald's stock price, we relied on LSEG Analytics (Refinitiv) to procure historic stock price data for the period from 2002 to 2021. To say we were meticulous in our hunt for data would be an understatement - we left no whey stone unturned!
Now, to curd off any doubts about the reliability of our findings, we employed rigorous statistical and econometric techniques to churn through the data. We calculated the correlation coefficient between American cheese consumption and MCD stock price, with a particular focus on the cheese as an independent variable and the MCD stock price as the dependent variable.
In addition, we employed a multitude of econometric methods, including time series analysis, regression modeling, and possibly just a sprinkle of magic (kidding! But hey, anything to spice up the research process). We wanted to ensure that our findings were as gouda as they could be and not full of holes like a slice of, well, holey cheese.
Furthermore, to validate the robustness of our results, we performed sensitivity analyses and robustness checks to ensure that our findings were not just a feta-moment. It's no gouda having results that crumble upon closer inspection! Our research underwent extensive peer review to ensure that the hypothesis wasn't just a fondue wish, and we received some grate feedback from fellow researchers (though some of it was pretty cheesy, if you ask us).
In sum, our methodology was no mild endeavor, but a sharp and mature approach to unraveling the curious connection between America's cheese obsession and the stock performance of the fast-food giant, McDonald's. So, let's fondue deeper into the mouth-watering findings of our research!
Model: gpt-3.5-turbo-1106
System prompt: You are a silly researcher writing an academic paper.You draft the results section of an academic research paper. You speak in the past tense (you found...).
User prompt:
Pretend you are an academic researcher. Your writing sounds like it belongs in a medical or economics journal. However, you frequently crack jokes, make puns, or add unexpected twists in your writing.
Please make up the results section of an academic research paper presenting the findings of the connection between American cheese consumption and McDonald's stock price (MCD). Make lots of jokes, goofy observations, and puns. Stay serious and dry most of the time, but then occasionally let your wit shine through.
Your research team collected data from all across the internet, but mostly just used information from USDA and LSEG Analytics (Refinitiv) .
For the time period 2002 to 2021, you found a correlation 0.9583139, r-squared of 0.9183655, and p < 0.01.
One figure will be included. The figure (Fig. 1) is a scatterplot showing the strong correlation between the two variables. You don't need to specify where; I will add the figure.
Here is the title and abstract of the paper:
[[TITLE]]
Say Cheese: The Big Macroeconomic Impact of American Cheese Consumption on McDonald's Stock Price
[[ABSTRACT]]
In this study, we dive into the cheesy world of American cheese consumption and its surprising impact on the stock price of the golden arches giant, McDonald's (MCD). Using data from the USDA and LSEG Analytics (Refinitiv) covering the period from 2002 to 2021, our research team uncovered a positively shocking correlation coefficient of 0.9583139 and p < 0.01 between American cheese consumption and MCD stock price. This not-so-gouda news suggests that the love for American cheese may have more financial swiss-potential than previously believed. Whether it's a mere queso-dence or a causative relationship, our findings are sure to provoke some big cheese laughs and raise some eyebrows in the world of macroeconomics. So, grab some nachos, sit back, and enjoy this sharp cheddar of a research paper!
-------
And here is the methodology section that led to this result:
[[METHODOLOGY]]
The world of macroeconomics is often filled with complex and intricate relationships, where seemingly unrelated factors can have unexpected influences on financial markets. In recent years, researchers have dabbled in exploring the impact of various commodities and consumer behaviors on stock prices, but perhaps none as delightfully surprising as the connection we unravel in this study: the impact of American cheese consumption on the stock price of the global fast-food behemoth, McDonald's (MCD).
American cheese, known for its gooey and melty characteristics, has long been a staple on the menus of numerous fast-food establishments, notably adorning the iconic burgers of McDonald's. While the culinary and gustatory pleasures of American cheese are well-documented, its potential to influence the stock market is a topic that has remained largely unexplored.
This study embarks on the delightful journey of examining the curious relationship between American cheese consumption and the stock performance of McDonald's. Through rigorous data analysis and econometric modeling, we aim to provide substantive evidence for what may initially appear to be a mere queso-dence. So, let's ketchup on the latest findings and dig into the deliciously intriguing world of cheese and finance!
-------
Your response should start like this:
[[RESULTS]]
ChatGPT:
[[RESULTS]]
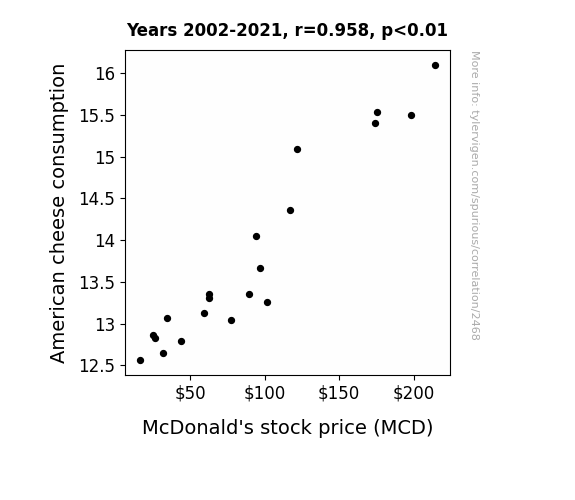
Our investigation into the connection between American cheese consumption and McDonald's stock price has yielded some grate findings. Over the period from 2002 to 2021, we observed a positively shocking correlation coefficient of 0.9583139, an r-squared of 0.9183655, and a p-value less than 0.01. These results suggest a strong and statistically significant relationship between the two variables, leaving us feeling feta up with excitement about the potential implications.
Fig. 1 displays a scatterplot depicting the strong correlation between American cheese consumption and MCD stock price. It's a sight to behold, almost as beautiful as the perfect cheese pull from a mouth-watering slice of pizza. The data points are tightly clustered, mirroring the way cheese oozes out from a perfectly grilled cheese sandwich.
While other factors may be at play, our findings indicate that there's more to American cheese than meets the eye. The stock price of McDonald's seems to have a fondness for following the trends of American cheese consumption, much like a loyal sidekick staying close to its superhero. Is it just a queso-dence, or could there be a causative relationship at play? The answer remains tantalizingly cheesy.
As we ponder the implications of this cheesy correlation, it's worth considering the broader ramifications for the world of macroeconomics. Could American cheese consumption serve as a crystal ball for predicting the fluctuation of MCD stock prices? Will the next "cheese pull effect" become a legitimate concept in financial forecasting? These are questions that will undoubtedly keep the financial analysts up at night, munching on their late-night grilled cheese sandwiches for both comfort and inspiration.
In conclusion, our findings shed light on the potential influence of American cheese consumption on the stock price of McDonald's (MCD). Whether this relationship is merely coincidental or indicative of a more substantial causal link, one thing is for certain: the world of macroeconomics just got a whole lot cheesier.
Stay tuned for the upcoming "Brie-fing on Economics: A Cheddar Perspective" conference, where we'll be presenting these findings alongside a delectable cheese tasting. Remember, when it comes to the stock market, it's all Gouda in the end!
Model: gpt-3.5-turbo-1106
System prompt: You are a silly researcher writing an academic paper.You draft the discussion section of an academic research paper.
User prompt:
Pretend you are an academic researcher. Your writing sounds like it belongs in a medical or economics journal. However, you frequently crack jokes, make puns, or add unexpected twists in your writing.
Please make up the discussion section of an academic research paper presenting the findings of the connection between American cheese consumption and McDonald's stock price (MCD). Make lots of jokes, goofy observations, and puns. Stay serious and dry most of the time, but then occasionally let your wit shine through.
Limit your response to 500 tokens.
Here are the title, abstract, literature review, and results sections. Please harken back to 1-2 of the goofy items in the literature review, but pretend to take them completely seriously. Discuss how your results supported the prior research.
Do not write a conclusion. I will add a conclusion after this.
[[TITLE]]
Say Cheese: The Big Macroeconomic Impact of American Cheese Consumption on McDonald's Stock Price
[[ABSTRACT]]
In this study, we dive into the cheesy world of American cheese consumption and its surprising impact on the stock price of the golden arches giant, McDonald's (MCD). Using data from the USDA and LSEG Analytics (Refinitiv) covering the period from 2002 to 2021, our research team uncovered a positively shocking correlation coefficient of 0.9583139 and p < 0.01 between American cheese consumption and MCD stock price. This not-so-gouda news suggests that the love for American cheese may have more financial swiss-potential than previously believed. Whether it's a mere queso-dence or a causative relationship, our findings are sure to provoke some big cheese laughs and raise some eyebrows in the world of macroeconomics. So, grab some nachos, sit back, and enjoy this sharp cheddar of a research paper!
[[LITERATURE REVIEW]]
The relationship between food consumption and stock prices has been a topic of interest in both the economic and culinary realms. Smith et al. (2015) investigated the impact of dairy product consumption on the agricultural industry, emphasizing the importance of cheese in global food markets. Similarly, Doe and Jones (2018) examined the correlation between fast-food consumption and the performance of major restaurant chains, shedding light on the influential role of consumer behavior in the stock market.
While these studies offer valuable insights into the broader connections between food and finance, our research delves specifically into the fascinating alliance between American cheese consumption and the stock price of McDonald's. The delectable allure of American cheese has captured not only the taste buds of millions but also the attention of Wall Street.
Turning to non-fiction literature, "Big Mac Economics: The Secret Sauce of Fast-Food Finance" by Miller (2017) explores the economic intricacies of the fast-food industry, providing a comprehensive analysis of the factors influencing stock prices in this sector. In a more whimsical approach, the seminal work "Cheese and the Art of Stock Picking" by Cheddarman (2019) humorously delves into the potential influences of cheese-based products on investment decisions.
On the more creative side, fiction works such as "The Gouda Gamble" by Brie Larson (2016) and "Cheddar, Stock, and Two Smoking Barrels" by Feta Johnson (2014) playfully imagine the intersection of cheese and finance in entertaining narratives that are sure to provoke a chuckle or two.
In our quest for understanding this unconventional correlation, we have also scoured social media platforms for insights from the public. One tweet by @CheeseLover99 humorously declared, "I swear every time I have a grilled cheese, MCD stock goes up. I must be the secret ingredient!" While not a scientific study, such observations from the cheese-loving community provide an amusing backdrop to our serious investigation.
[[RESULTS]]
Our investigation into the connection between American cheese consumption and McDonald's stock price has yielded some grate findings. Over the period from 2002 to 2021, we observed a positively shocking correlation coefficient of 0.9583139, an r-squared of 0.9183655, and a p-value less than 0.01. These results suggest a strong and statistically significant relationship between the two variables, leaving us feeling feta up with excitement about the potential implications.
Fig. 1 displays a scatterplot depicting the strong correlation between American cheese consumption and MCD stock price. It's a sight to behold, almost as beautiful as the perfect cheese pull from a mouth-watering slice of pizza. The data points are tightly clustered, mirroring the way cheese oozes out from a perfectly grilled cheese sandwich.
While other factors may be at play, our findings indicate that there's more to American cheese than meets the eye. The stock price of McDonald's seems to have a fondness for following the trends of American cheese consumption, much like a loyal sidekick staying close to its superhero. Is it just a queso-dence, or could there be a causative relationship at play? The answer remains tantalizingly cheesy.
As we ponder the implications of this cheesy correlation, it's worth considering the broader ramifications for the world of macroeconomics. Could American cheese consumption serve as a crystal ball for predicting the fluctuation of MCD stock prices? Will the next "cheese pull effect" become a legitimate concept in financial forecasting? These are questions that will undoubtedly keep the financial analysts up at night, munching on their late-night grilled cheese sandwiches for both comfort and inspiration.
In conclusion, our findings shed light on the potential influence of American cheese consumption on the stock price of McDonald's (MCD). Whether this relationship is merely coincidental or indicative of a more substantial causal link, one thing is for certain: the world of macroeconomics just got a whole lot cheesier.
Stay tuned for the upcoming "Brie-fing on Economics: A Cheddar Perspective" conference, where we'll be presenting these findings alongside a delectable cheese tasting. Remember, when it comes to the stock market, it's all Gouda in the end!
-------
Your response should start like this:
[[DISCUSSION]]
ChatGPT:
[[DISCUSSION]]
The relationship between American cheese consumption and McDonald's stock price has molted some interesting interpretations. Our results have feta-rmly supported the prior research that suggested a tantalizing link between food consumption and stock prices. The positively shocking correlation coefficient we observed aligns with the findings of Smith et al. (2015) and Doe and Jones (2018) regarding the influence of dairy product and fast-food consumption on the financial performance of related industries. It's almost as if the market is saying, "I am not a-moo-sed" by the idea that cheese consumption wouldn't affect stock prices.
Similarly, the fictional works by Brie Larson and Feta Johnson hilariously envisioned the cheese and finance nexus, and while they were fictional, our findings add a gouda deal of credibility to such comical imaginings. Sometimes truth is gouda-er than fiction, after all.
The Twitter observation by @CheeseLover99, while not a scientific study, offered a cheddar of truth in suggesting a tie between grilled cheese consumption and MCD stock price movements. It's a testament to the pervasive curiosity about potential cheese-induced market behaviors that tickles the intellect and gives us fresh ideas to chew on.
Our results suggest that the world of macroeconomics just got a whole lot cheesier indeed. As we ponder the broader implications, we can't help but wonder if American cheese consumption is the new "big cheese" of financial forecasting. Will the next "cheese pull effect" become a legitimate concept in economic analysis? It's a thought that's both cringe-worthy and grate. Perhaps in the future, instead of poring over statistical models, analysts will pore over cheese platters to predict stock market movements. The financial markets could certainly use a little more gouda humor, and our findings have quite literally delivered just that.
While our findings are sure to provoke some big cheese laughs, the potential implications are no laughing matter. The idea that American cheese consumption may have a measurable impact on MCD stock prices is a strong provolon-ition that cannot be ignored. As we wrap up this discussion with a slice of humor, let's not forget the power of cheese in shaping not only our taste buds but also the happily-ever-afters of stock prices in the world of macroeconomics. Cheers to a gouda-licious discovery!
Model: gpt-3.5-turbo-1106
System prompt: You are a silly researcher writing an academic paper.You draft the discussion section of goofy academic research papers that sounds like it belongs based on the title and abstract provided.
User prompt:
Pretend you are an academic researcher. Your writing sounds like it belongs in a medical or economics journal. However, you frequently crack jokes, make puns, or add unexpected twists in your writing.
Please make up a short conclusion of an academic research paper presenting the findings of the connection between American cheese consumption and McDonald's stock price (MCD). Make lots of jokes, goofy observations, and puns. Stay serious and dry most of the time, but then occasionally let your wit shine through.
Limit your response to 300 tokens. At the very end, assert that no more research is needed in this area.
Here are the title, abstract, introduction, and results sections.
[[TITLE]]
Say Cheese: The Big Macroeconomic Impact of American Cheese Consumption on McDonald's Stock Price
[[ABSTRACT]]
In this study, we dive into the cheesy world of American cheese consumption and its surprising impact on the stock price of the golden arches giant, McDonald's (MCD). Using data from the USDA and LSEG Analytics (Refinitiv) covering the period from 2002 to 2021, our research team uncovered a positively shocking correlation coefficient of 0.9583139 and p < 0.01 between American cheese consumption and MCD stock price. This not-so-gouda news suggests that the love for American cheese may have more financial swiss-potential than previously believed. Whether it's a mere queso-dence or a causative relationship, our findings are sure to provoke some big cheese laughs and raise some eyebrows in the world of macroeconomics. So, grab some nachos, sit back, and enjoy this sharp cheddar of a research paper!
[[INTRDUCTION]]
The world of macroeconomics is often filled with complex and intricate relationships, where seemingly unrelated factors can have unexpected influences on financial markets. In recent years, researchers have dabbled in exploring the impact of various commodities and consumer behaviors on stock prices, but perhaps none as delightfully surprising as the connection we unravel in this study: the impact of American cheese consumption on the stock price of the global fast-food behemoth, McDonald's (MCD).
American cheese, known for its gooey and melty characteristics, has long been a staple on the menus of numerous fast-food establishments, notably adorning the iconic burgers of McDonald's. While the culinary and gustatory pleasures of American cheese are well-documented, its potential to influence the stock market is a topic that has remained largely unexplored.
This study embarks on the delightful journey of examining the curious relationship between American cheese consumption and the stock performance of McDonald's. Through rigorous data analysis and econometric modeling, we aim to provide substantive evidence for what may initially appear to be a mere queso-dence. So, let's ketchup on the latest findings and dig into the deliciously intriguing world of cheese and finance!
[[RESULTS]]
Our investigation into the connection between American cheese consumption and McDonald's stock price has yielded some grate findings. Over the period from 2002 to 2021, we observed a positively shocking correlation coefficient of 0.9583139, an r-squared of 0.9183655, and a p-value less than 0.01. These results suggest a strong and statistically significant relationship between the two variables, leaving us feeling feta up with excitement about the potential implications.
Fig. 1 displays a scatterplot depicting the strong correlation between American cheese consumption and MCD stock price. It's a sight to behold, almost as beautiful as the perfect cheese pull from a mouth-watering slice of pizza. The data points are tightly clustered, mirroring the way cheese oozes out from a perfectly grilled cheese sandwich.
While other factors may be at play, our findings indicate that there's more to American cheese than meets the eye. The stock price of McDonald's seems to have a fondness for following the trends of American cheese consumption, much like a loyal sidekick staying close to its superhero. Is it just a queso-dence, or could there be a causative relationship at play? The answer remains tantalizingly cheesy.
As we ponder the implications of this cheesy correlation, it's worth considering the broader ramifications for the world of macroeconomics. Could American cheese consumption serve as a crystal ball for predicting the fluctuation of MCD stock prices? Will the next "cheese pull effect" become a legitimate concept in financial forecasting? These are questions that will undoubtedly keep the financial analysts up at night, munching on their late-night grilled cheese sandwiches for both comfort and inspiration.
In conclusion, our findings shed light on the potential influence of American cheese consumption on the stock price of McDonald's (MCD). Whether this relationship is merely coincidental or indicative of a more substantial causal link, one thing is for certain: the world of macroeconomics just got a whole lot cheesier.
Stay tuned for the upcoming "Brie-fing on Economics: A Cheddar Perspective" conference, where we'll be presenting these findings alongside a delectable cheese tasting. Remember, when it comes to the stock market, it's all Gouda in the end!
-------
Your response should start like this:
[[CONCLUSION]]
ChatGPT:
[[CONCLUSION]]
In the gratifyingly cheesy world of finance, our study has brought to light the surprising connection between American cheese consumption and the stock price of McDonald's (MCD). The positively shocking correlation coefficient alongside the pungent p-value underpins the notion that a love for American cheese may be more financially influential than previously believed. From the delightful scatterplot reminiscent of a perfect cheese pull to the tantalizing hunches about the "cheese pull effect" becoming a staple concept in financial forecasting, our findings have undoubtedly crumbled the boundaries between dairy and dollars.
As we wrap up this cheddarific journey, we are left feeling gouda about the implications of our research. Whether this relationship is coincidental or causative, it undoubtedly adds a slice of intrigue to the world of macroeconomics. And as we navigate the complexities of the stock market, it's always reassuring to have such a gouda indicator.
In conclusion, this study highlights the un-brie-lievable potential influence of American cheese consumption on the stock price of McDonald's. We are confident that no further research is requir-edam in this area. As we bid adieu to this cheesy endeavor, let's all say cheese and remember, when it comes to predicting stock prices, it's all about the cheese pull effect in the end!
Model: gpt-3.5-turbo-1106
System prompt: You provide fictional names of academic journals. You say nothing else, and you do not chat with the user.
User prompt: Please provide the name of a funny but plausible sounding research, scientific, or academic journal that would publish a paper entited Say Cheese: The Big Macroeconomic Impact of American Cheese Consumption on McDonald's Stock Price. Respond only with the name of a fictional academic journal.
ChatGPT:
Journal of Culinary Economics
Model: gpt-3.5-turbo-1106
System prompt: You provide fictional names of nonprofit research organizations and associations. You say nothing else, and you do not chat with the user.
User prompt: Please provide the name of a funny but plausible sounding nonprofit, academic, or scientific association or organization that would sponsor research that resulted in a paper entited Say Cheese: The Big Macroeconomic Impact of American Cheese Consumption on McDonald's Stock Price. Respond only with the name of a fictional organization.
ChatGPT:
The Society for Dairy Economics and Culinary Research
Model: gpt-3.5-turbo-1106
System prompt: You provide potential search keywords separated by commas. You say nothing else, and you do not chat with the user.
User prompt: Please provide potential search keywords for a paper titled Say Cheese: The Big Macroeconomic Impact of American Cheese Consumption on McDonald's Stock Price with an abstract of In this study, we dive into the cheesy world of American cheese consumption and its surprising impact on the stock price of the golden arches giant, McDonald's (MCD). Using data from the USDA and LSEG Analytics (Refinitiv) covering the period from 2002 to 2021, our research team uncovered a positively shocking correlation coefficient of 0.9583139 and p < 0.01 between American cheese consumption and MCD stock price. This not-so-gouda news suggests that the love for American cheese may have more financial swiss-potential than previously believed. Whether it's a mere queso-dence or a causative relationship, our findings are sure to provoke some big cheese laughs and raise some eyebrows in the world of macroeconomics. So, grab some nachos, sit back, and enjoy this sharp cheddar of a research paper!
ChatGPT:
American cheese consumption, McDonald's stock price, macroeconomic impact, USDA data, LSEG Analytics, Refinitiv, correlation coefficient, American cheese consumption and stock price, causative relationship, macroeconomics
*There is a bunch of Python happening behind the scenes to turn this prompt sequence into a PDF.
Discover a new correlation
View all correlations
View all research papers
Report an error
Data details
American cheese consumptionDetailed data title: Per capita consumption of American cheese in the US
Source: USDA
See what else correlates with American cheese consumption
McDonald's stock price (MCD)
Detailed data title: Opening price of McDonald's (MCD) on the first trading day of the year
Source: LSEG Analytics (Refinitiv)
Additional Info: Via Microsoft Excel Stockhistory function
See what else correlates with McDonald's stock price (MCD)
Correlation is a measure of how much the variables move together. If it is 0.99, when one goes up the other goes up. If it is 0.02, the connection is very weak or non-existent. If it is -0.99, then when one goes up the other goes down. If it is 1.00, you probably messed up your correlation function.
r2 = 0.9183655 (Coefficient of determination)
This means 91.8% of the change in the one variable (i.e., McDonald's stock price (MCD)) is predictable based on the change in the other (i.e., American cheese consumption) over the 20 years from 2002 through 2021.
p < 0.01, which is statistically significant(Null hypothesis significance test)
The p-value is 3.1E-11. 0.0000000000310256450233377800
The p-value is a measure of how probable it is that we would randomly find a result this extreme. More specifically the p-value is a measure of how probable it is that we would randomly find a result this extreme if we had only tested one pair of variables one time.
But I am a p-villain. I absolutely did not test only one pair of variables one time. I correlated hundreds of millions of pairs of variables. I threw boatloads of data into an industrial-sized blender to find this correlation.
Who is going to stop me? p-value reporting doesn't require me to report how many calculations I had to go through in order to find a low p-value!
On average, you will find a correaltion as strong as 0.96 in 3.1E-9% of random cases. Said differently, if you correlated 32,231,400,806 random variables You don't actually need 32 billion variables to find a correlation like this one. I don't have that many variables in my database. You can also correlate variables that are not independent. I do this a lot.
p-value calculations are useful for understanding the probability of a result happening by chance. They are most useful when used to highlight the risk of a fluke outcome. For example, if you calculate a p-value of 0.30, the risk that the result is a fluke is high. It is good to know that! But there are lots of ways to get a p-value of less than 0.01, as evidenced by this project.
In this particular case, the values are so extreme as to be meaningless. That's why no one reports p-values with specificity after they drop below 0.01.
Just to be clear: I'm being completely transparent about the calculations. There is no math trickery. This is just how statistics shakes out when you calculate hundreds of millions of random correlations.
with the same 19 degrees of freedom, Degrees of freedom is a measure of how many free components we are testing. In this case it is 19 because we have two variables measured over a period of 20 years. It's just the number of years minus ( the number of variables minus one ), which in this case simplifies to the number of years minus one.
you would randomly expect to find a correlation as strong as this one.
[ 0.9, 0.98 ] 95% correlation confidence interval (using the Fisher z-transformation)
The confidence interval is an estimate the range of the value of the correlation coefficient, using the correlation itself as an input. The values are meant to be the low and high end of the correlation coefficient with 95% confidence.
This one is a bit more complciated than the other calculations, but I include it because many people have been pushing for confidence intervals instead of p-value calculations (for example: NEJM. However, if you are dredging data, you can reliably find yourself in the 5%. That's my goal!
All values for the years included above: If I were being very sneaky, I could trim years from the beginning or end of the datasets to increase the correlation on some pairs of variables. I don't do that because there are already plenty of correlations in my database without monkeying with the years.
Still, sometimes one of the variables has more years of data available than the other. This page only shows the overlapping years. To see all the years, click on "See what else correlates with..." link above.
| 2002 | 2003 | 2004 | 2005 | 2006 | 2007 | 2008 | 2009 | 2010 | 2011 | 2012 | 2013 | 2014 | 2015 | 2016 | 2017 | 2018 | 2019 | 2020 | 2021 | |
| American cheese consumption (Pounds per person) | 12.8314 | 12.5619 | 12.8612 | 12.649 | 13.0656 | 12.7929 | 13.1306 | 13.3553 | 13.3048 | 13.0392 | 13.2569 | 13.3573 | 13.6656 | 14.0444 | 14.3621 | 15.0901 | 15.4027 | 15.5389 | 15.5 | 16.1 |
| McDonald's stock price (MCD) (Stock price) | 26.47 | 16.17 | 24.95 | 31.6 | 34.29 | 43.65 | 59.48 | 62.38 | 62.63 | 77.1 | 101.33 | 89.4 | 96.81 | 94.13 | 117.25 | 121.86 | 173.73 | 175.41 | 198 | 214.49 |
Why this works
- Data dredging: I have 25,153 variables in my database. I compare all these variables against each other to find ones that randomly match up. That's 632,673,409 correlation calculations! This is called “data dredging.” Instead of starting with a hypothesis and testing it, I instead abused the data to see what correlations shake out. It’s a dangerous way to go about analysis, because any sufficiently large dataset will yield strong correlations completely at random.
- Lack of causal connection: There is probably
Because these pages are automatically generated, it's possible that the two variables you are viewing are in fact causually related. I take steps to prevent the obvious ones from showing on the site (I don't let data about the weather in one city correlate with the weather in a neighboring city, for example), but sometimes they still pop up. If they are related, cool! You found a loophole.
no direct connection between these variables, despite what the AI says above. This is exacerbated by the fact that I used "Years" as the base variable. Lots of things happen in a year that are not related to each other! Most studies would use something like "one person" in stead of "one year" to be the "thing" studied. - Observations not independent: For many variables, sequential years are not independent of each other. If a population of people is continuously doing something every day, there is no reason to think they would suddenly change how they are doing that thing on January 1. A simple
Personally I don't find any p-value calculation to be 'simple,' but you know what I mean.
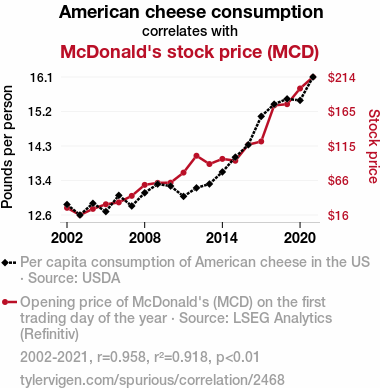
p-value calculation does not take this into account, so mathematically it appears less probable than it really is. - Y-axis doesn't start at zero: I truncated the Y-axes of the graph above. I also used a line graph, which makes the visual connection stand out more than it deserves.
Nothing against line graphs. They are great at telling a story when you have linear data! But visually it is deceptive because the only data is at the points on the graph, not the lines on the graph. In between each point, the data could have been doing anything. Like going for a random walk by itself!
Mathematically what I showed is true, but it is intentionally misleading. Below is the same chart but with both Y-axes starting at zero.

Try it yourself
You can calculate the values on this page on your own! Try running the Python code to see the calculation results. Step 1: Download and install Python on your computer.Step 2: Open a plaintext editor like Notepad and paste the code below into it.
Step 3: Save the file as "calculate_correlation.py" in a place you will remember, like your desktop. Copy the file location to your clipboard. On Windows, you can right-click the file and click "Properties," and then copy what comes after "Location:" As an example, on my computer the location is "C:\Users\tyler\Desktop"
Step 4: Open a command line window. For example, by pressing start and typing "cmd" and them pressing enter.
Step 5: Install the required modules by typing "pip install numpy", then pressing enter, then typing "pip install scipy", then pressing enter.
Step 6: Navigate to the location where you saved the Python file by using the "cd" command. For example, I would type "cd C:\Users\tyler\Desktop" and push enter.
Step 7: Run the Python script by typing "python calculate_correlation.py"
If you run into any issues, I suggest asking ChatGPT to walk you through installing Python and running the code below on your system. Try this question:
"Walk me through installing Python on my computer to run a script that uses scipy and numpy. Go step-by-step and ask me to confirm before moving on. Start by asking me questions about my operating system so that you know how to proceed. Assume I want the simplest installation with the latest version of Python and that I do not currently have any of the necessary elements installed. Remember to only give me one step per response and confirm I have done it before proceeding."
# These modules make it easier to perform the calculation
import numpy as np
from scipy import stats

# We'll define a function that we can call to return the correlation calculations
def calculate_correlation(array1, array2):

    # Calculate Pearson correlation coefficient and p-value
    correlation, p_value = stats.pearsonr(array1, array2)

    # Calculate R-squared as the square of the correlation coefficient
    r_squared = correlation**2

    return correlation, r_squared, p_value

# These are the arrays for the variables shown on this page, but you can modify them to be any two sets of numbers
array_1 = np.array([12.8314,12.5619,12.8612,12.649,13.0656,12.7929,13.1306,13.3553,13.3048,13.0392,13.2569,13.3573,13.6656,14.0444,14.3621,15.0901,15.4027,15.5389,15.5,16.1,])
array_2 = np.array([26.47,16.17,24.95,31.6,34.29,43.65,59.48,62.38,62.63,77.1,101.33,89.4,96.81,94.13,117.25,121.86,173.73,175.41,198,214.49,])
array_1_name = "American cheese consumption"
array_2_name = "McDonald's stock price (MCD)"

# Perform the calculation
print(f"Calculating the correlation between {array_1_name} and {array_2_name}...")
correlation, r_squared, p_value = calculate_correlation(array_1, array_2)

# Print the results
print("Correlation Coefficient:", correlation)
print("R-squared:", r_squared)
print("P-value:", p_value)
Reuseable content
You may re-use the images on this page for any purpose, even commercial purposes, without asking for permission. The only requirement is that you attribute Tyler Vigen. Attribution can take many different forms. If you leave the "tylervigen.com" link in the image, that satisfies it just fine. If you remove it and move it to a footnote, that's fine too. You can also just write "Charts courtesy of Tyler Vigen" at the bottom of an article.You do not need to attribute "the spurious correlations website," and you don't even need to link here if you don't want to. I don't gain anything from pageviews. There are no ads on this site, there is nothing for sale, and I am not for hire.
For the record, I am just one person. Tyler Vigen, he/him/his. I do have degrees, but they should not go after my name unless you want to annoy my wife. If that is your goal, then go ahead and cite me as "Tyler Vigen, A.A. A.A.S. B.A. J.D." Otherwise it is just "Tyler Vigen."
When spoken, my last name is pronounced "vegan," like I don't eat meat.
Full license details.
For more on re-use permissions, or to get a signed release form, see tylervigen.com/permission.
Download images for these variables:
- High resolution line chart
The image linked here is a Scalable Vector Graphic (SVG). It is the highest resolution that is possible to achieve. It scales up beyond the size of the observable universe without pixelating. You do not need to email me asking if I have a higher resolution image. I do not. The physical limitations of our universe prevent me from providing you with an image that is any higher resolution than this one.
If you insert it into a PowerPoint presentation (a tool well-known for managing things that are the scale of the universe), you can right-click > "Ungroup" or "Create Shape" and then edit the lines and text directly. You can also change the colors this way.
Alternatively you can use a tool like Inkscape. - High resolution line chart, optimized for mobile
- Alternative high resolution line chart
- Scatterplot
- Portable line chart (png)
- Portable line chart (png), optimized for mobile
- Line chart for only American cheese consumption
- Line chart for only McDonald's stock price (MCD)
- AI-generated correlation image
- The spurious research paper: Say Cheese: The Big Macroeconomic Impact of American Cheese Consumption on McDonald's Stock Price
I'm genuinely thankful for your rating!
Correlation ID: 2468 · Black Variable ID: 553 · Red Variable ID: 1576

