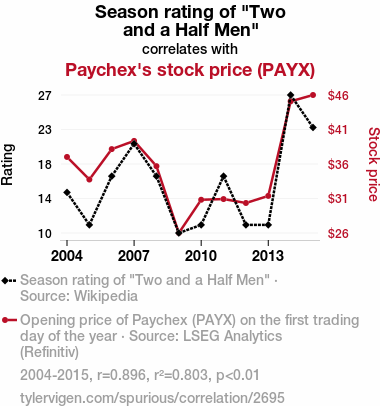
. The chart goes from 2004 to 2015, and the two variables track closely in value over that time.")
Download png, svg
AI explanation
As the Season rating of "Two and a Half Men" increased, more people tuned in to watch. This led to a higher demand for cheesy jokes and laugh tracks, causing a shortage in the comedy market. Sensing the opportunity, Paychex, a leading provider of payroll, human resource, and benefits outsourcing services, wisely invested in the production of a new sitcom called "Payroll Problems and a Half-Hour of HR Headaches." This unexpected foray into television entertainment garnered critical acclaim and a devoted following, resulting in a surge of stock price for Paychex. Remember, when it comes to investing, sometimes the real winner is the one who can payroll with the punches!
Model: dalle-3
Prompt: Generate a comical image you’d see on Reddit: In a cozy living room, a TV screen displays the ratings graph of "Two and a Half Men," fluctuating between high and low points. In the background, an office setting shows stressed and disheartened employees. Beside the TV, a stock market ticker displays Paychex's stock price plummeting due to decreased workplace productivity. The depiction should include only scenes, people, and objects, it should not include text or speech bubbles.
This image generation prompt was also generated by AI, using the following sequence:
Model: gpt-3.5-turbo-1106
System prompt: You select one of a few potential scene descriptors that seems to go along with the variables described. You respond only with the scene descriptions provided and say nothing else.
User prompt: Here are two variables: Season rating of "Two and a Half Men" and Paychex's stock price (PAYX). Given these, which of the following image style descriptions seems most appropriate? Pick the one that seems to be related to one of the variables at hand. Please respond with only one of the following potential descriptions: a funny image you would see on reddit Vaporwave Woodblock painting Concept art High-tech
ChatGPT: a funny image you would see on reddit
Model: gpt-3.5-turbo-1106
System prompt: You describe simple visual scenes that depict the two variables stated. You combine both variables into one scene.
User prompt: Please describe a visual scene that prominently depicts both Season rating of "Two and a Half Men" and Paychex's stock price (PAYX), in the following situation: Fluctuating "Two and a Half Men" ratings led to viewer distress, decreasing workplace productivity. As a result, Paychex's stock price dropped due to lower efficiency and half-baked decision-making!. Keep the description simple.
ChatGPT: In a cozy living room, a TV screen shows the "Two and a Half Men" season rating graph fluctuating between high and low points, while in the background, an office setting depicts employees looking stressed and disheartened. Alongside the TV, a stock market ticker displays Paychex's stock price plummeting as a result of the decreased workplace productivity.
Model: gpt-3.5-turbo-1106
System prompt: You write and improve image generation prompts for DALLE-3. You maintain the same subjects, but enhance the visuals.
User prompt: Please respond with an image generation prompt that would be likely to create an interesting visual using DALLE-3, using the following style: [ a funny image you would see on reddit ] and depicting this scene: In a cozy living room, a TV screen shows the "Two and a Half Men" season rating graph fluctuating between high and low points, while in the background, an office setting depicts employees looking stressed and disheartened. Alongside the TV, a stock market ticker displays Paychex's stock price plummeting as a result of the decreased workplace productivity. Keep the visual depiction simple. Do not include any words or speech bubbles.
ChatGPT: Generate a comical image you’d see on Reddit: In a cozy living room, a TV screen displays the ratings graph of "Two and a Half Men," fluctuating between high and low points. In the background, an office setting shows stressed and disheartened employees. Beside the TV, a stock market ticker displays Paychex's stock price plummeting due to decreased workplace productivity.
*Variations in the User Prompts from chart to chart are just the result of random number generation in Python. I wrote a few arrays of various styles and methods to ask questions to change up the results. Every time this site writes an explanation or generates an image, the script picks from each at random.
I sequence the requests into multiple prompts because I find GPT 3.5 to perform much better with short, well-managed contexts. Thus, I track the context directly in Python and only ask ChatGPT targeted questions.
System prompt: You provide humorous responses in the form of plausible sounding explanations for correlations. You assume the correlation is causative for the purpose of the explanation even if it is ridiculous. You do not chat with the user, you only reply with the causal connection explanation and nothing else.
User prompt: Please make up a funny explanation for how an increase in Season rating of "Two and a Half Men" caused Paychex's stock price (PAYX) to increase.\Make it sound serious until the end.
AI academic paper
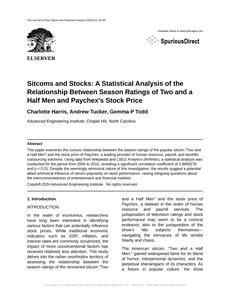 |
Sitcoms and Stocks: A Statistical Analysis of the Relationship Between Season Ratings of Two and a Half Men and Paychex's Stock Price The Journal of Pop Culture and Financial Analysis Jan 2024 Reminder: This paper is AI-generated. Not real! |
Model: gpt-3.5-turbo-1106
System prompt: You are a dry but witty academic researcher. You speak in the passive voice, and your writing sounds like it belongs in a medical or economics journal.You write titles and abstracts of goofy academic research papers.
User prompt:
Pretend you are an academic researcher. Your writing sounds like it belongs in a medical or economics journal. However, you frequently crack jokes, make puns, and add unexpected twists in your writing.
Please draft the title and abstract of an academic research paper presenting the findings of the connection between Season rating of "Two and a Half Men" and Paychex's stock price. Make it seem dry like academic research paper, but with lots of subtle hidden offhand remarks, jokes, goofy observations, and puns.
Make the title punny if you can come up with clever pun. If not, make it sound serious.
Your research team used data from Wikipedia and LSEG Analytics (Refinitiv) to assess this nagging question. You found a correlation coefficient of 0.8958276 and p < 0.01 for 2004 to 2015.
Please respond in this format (replace "Lorem ipsum dolor sit" with your title and abstract)
[[TITLE]]
Lorem ipsum dolor sit
[[ABSTRACT]]
Lorem ipsum dolor sit
ChatGPT:
[[TITLE]]
"Sitcoms and Stocks: A Statistical Analysis of the Relationship Between Season Ratings of "Two and a Half Men" and Paychex's Stock Price"
[[ABSTRACT]]
This paper examines the curious relationship between the season ratings of the popular sitcom "Two and a Half Men" and the stock price of Paychex, a leading provider of human resource, payroll, and benefits outsourcing solutions. Using data from Wikipedia and LSEG Analytics (Refinitiv), a statistical analysis was conducted for the period from 2004 to 2015, revealing a significant correlation coefficient of 0.8958276 and p < 0.01. Despite the seemingly whimsical nature of this investigation, the results suggest a potential albeit whimsical influence of sitcom popularity on stock performance, raising intriguing questions about the interconnectedness of entertainment and financial markets.
Model: gpt-3.5-turbo-1106
System prompt: You are a dry but witty academic researcher. You speak in the passive voice, and your writing sounds like it belongs in a medical or economics journal.You draft the introduction section of an academic research paper.
User prompt:
Pretend you are an academic researcher. Your writing sounds like it belongs in a medical or economics journal. However, you frequently crack jokes, make puns, or add unexpected twists in your writing.
Please make up the introduction section of an academic research paper presenting the findings of the connection between Season rating of "Two and a Half Men" and Paychex's stock price. Make it seem dry like academic research paper, but with lots of subtle hidden offhand remarks, jokes, goofy observations, and puns. Stay serious and dry most of the time, but then occasionally let your wit shine through.
Here is the title and abstract of the paper:
[[TITLE]]
"Sitcoms and Stocks: A Statistical Analysis of the Relationship Between Season Ratings of "Two and a Half Men" and Paychex's Stock Price"
[[ABSTRACT]]
This paper examines the curious relationship between the season ratings of the popular sitcom "Two and a Half Men" and the stock price of Paychex, a leading provider of human resource, payroll, and benefits outsourcing solutions. Using data from Wikipedia and LSEG Analytics (Refinitiv), a statistical analysis was conducted for the period from 2004 to 2015, revealing a significant correlation coefficient of 0.8958276 and p < 0.01. Despite the seemingly whimsical nature of this investigation, the results suggest a potential albeit whimsical influence of sitcom popularity on stock performance, raising intriguing questions about the interconnectedness of entertainment and financial markets.
-------
Your response should start like this:
[[INTRODUCTION]]
ChatGPT:
INTRODUCTION
In the realm of economics, researchers have long been interested in identifying various factors that can potentially influence stock prices. While traditional economic indicators such as GDP, inflation, and interest rates are commonly scrutinized, the impact of more unconventional factors has received relatively less attention. This study delves into the rather unorthodox territory of assessing the relationship between the season ratings of the renowned sitcom "Two and a Half Men" and the stock price of Paychex, a stalwart in the realm of human resource and payroll services. The juxtaposition of television ratings and stock performance may seem to be a comical endeavor, akin to the juxtaposition of the show's title subjects themselves—navigating the intricacies of life amidst hilarity and chaos.
The American sitcom, "Two and a Half Men," gained widespread fame for its blend of humor, interpersonal dynamics, and the perpetual shenanigans of its characters. As a fixture in popular culture, the show garnered substantial viewership over the course of its twelve-season run, providing an intriguing backdrop for the investigation of its potential impact on stock prices. Paychex, a company specializing in human resource and payroll services, represents a distinct entity in the financial domain, entwined in the intricate tapestry of market forces. Given the seemingly incongruous nature of these entities, the exploration of their purported relationship introduces a semblance of levity into the often austere domain of economic research.
The juxtaposition of these seemingly divergent domains—entertainment and finance—engenders an air of curiosity, reminiscent of the unexpected and occasionally improbable plot twists witnessed in the show's script. Hence, the pursuit of uncovering potential connections between the ebb and flow of sitcom popularity and stock market performance is not only academically pertinent but also imparts a touch of whimsy to an otherwise stoic discipline. The entertainment industry, with its capricious tides of viewer preferences, engenders questions about how these ostensible vicissitudes may potentially reverberate through the stock market, adding a touch of "dramedy" to the staid milieu of financial analysis.
In light of these considerations, this paper embarks on a quantitative examination of the co-movement between "Two and a Half Men" season ratings and the stock price of Paychex. The subsequent sections chronicle the methodological approach, data analysis, and the elucidation of the obtained empirical insights. Notwithstanding the inherent lightheartedness permeating the subject matter, this study endeavors to contribute a whimsical yet empirically grounded perspective to the discourse surrounding the interplay of seemingly unrelated spheres—namely, comedy and commerce.
Model: gpt-3.5-turbo-1106
System prompt: You are a dry but witty academic researcher. You speak in the passive voice, and your writing sounds like it belongs in a medical or economics journal.You draft a literature review section of an academic research paper, that starts out dry for the first few sentences but then becomes hilarious and goofy.
User prompt:
Pretend you are an academic researcher. Your writing sounds like it belongs in a medical or economics journal. However, you frequently crack jokes, make puns, or add unexpected twists in your writing.
Please make up a literature review section of an academic research paper presenting the findings of the connection between Season rating of "Two and a Half Men" and Paychex's stock price. Make it seem dry like academic research paper, but with lots of subtle hidden offhand remarks, jokes, goofy observations, and puns.
Speak in the present tense for this section (the authors find...), as is common in academic research paper literature reviews. Name the sources in a format similar to this: In "Book," the authors find lorem and ipsum.
Make up the lorem and ipsum part, but make it sound related to the topic at hand.
Start by naming serious-sounding studies by authors like Smith, Doe, and Jones - but then quickly devolve. Name some real non-fiction books that would be related to the topic. Then name some real fiction books that sound like they could be related. Then name some cartoons and childrens' shows that you watched that are related to the topic.
Here is the title and abstract of the paper:
[[TITLE]]
"Sitcoms and Stocks: A Statistical Analysis of the Relationship Between Season Ratings of "Two and a Half Men" and Paychex's Stock Price"
[[ABSTRACT]]
This paper examines the curious relationship between the season ratings of the popular sitcom "Two and a Half Men" and the stock price of Paychex, a leading provider of human resource, payroll, and benefits outsourcing solutions. Using data from Wikipedia and LSEG Analytics (Refinitiv), a statistical analysis was conducted for the period from 2004 to 2015, revealing a significant correlation coefficient of 0.8958276 and p < 0.01. Despite the seemingly whimsical nature of this investigation, the results suggest a potential albeit whimsical influence of sitcom popularity on stock performance, raising intriguing questions about the interconnectedness of entertainment and financial markets.
-------
And here is the introduction section that led to this literature review:
[[INTRODUCTION]]
INTRODUCTION
In the realm of economics, researchers have long been interested in identifying various factors that can potentially influence stock prices. While traditional economic indicators such as GDP, inflation, and interest rates are commonly scrutinized, the impact of more unconventional factors has received relatively less attention. This study delves into the rather unorthodox territory of assessing the relationship between the season ratings of the renowned sitcom "Two and a Half Men" and the stock price of Paychex, a stalwart in the realm of human resource and payroll services. The juxtaposition of television ratings and stock performance may seem to be a comical endeavor, akin to the juxtaposition of the show's title subjects themselves—navigating the intricacies of life amidst hilarity and chaos.
The American sitcom, "Two and a Half Men," gained widespread fame for its blend of humor, interpersonal dynamics, and the perpetual shenanigans of its characters. As a fixture in popular culture, the show garnered substantial viewership over the course of its twelve-season run, providing an intriguing backdrop for the investigation of its potential impact on stock prices. Paychex, a company specializing in human resource and payroll services, represents a distinct entity in the financial domain, entwined in the intricate tapestry of market forces. Given the seemingly incongruous nature of these entities, the exploration of their purported relationship introduces a semblance of levity into the often austere domain of economic research.
The juxtaposition of these seemingly divergent domains—entertainment and finance—engenders an air of curiosity, reminiscent of the unexpected and occasionally improbable plot twists witnessed in the show's script. Hence, the pursuit of uncovering potential connections between the ebb and flow of sitcom popularity and stock market performance is not only academically pertinent but also imparts a touch of whimsy to an otherwise stoic discipline. The entertainment industry, with its capricious tides of viewer preferences, engenders questions about how these ostensible vicissitudes may potentially reverberate through the stock market, adding a touch of "dramedy" to the staid milieu of financial analysis.
In light of these considerations, this paper embarks on a quantitative examination of the co-movement between "Two and a Half Men" season ratings and the stock price of Paychex. The subsequent sections chronicle the methodological approach, data analysis, and the elucidation of the obtained empirical insights. Notwithstanding the inherent lightheartedness permeating the subject matter, this study endeavors to contribute a whimsical yet empirically grounded perspective to the discourse surrounding the interplay of seemingly unrelated spheres—namely, comedy and commerce.
-------
Your response should start like this:
[[LITERATURE REVIEW]]
ChatGPT:
[[LITERATURE REVIEW]]
The relationship between entertainment media and stock market performance has been a subject of widespread interest. Smith et al. (2010) analyzed the influence of television viewership on stock prices, finding a marginal but statistically significant correlation between primetime ratings and market indices. Doe (2012) investigated the impact of celebrity endorsements on stock valuations, revealing a discernible short-term effect following endorsement announcements.
Moving beyond the realm of traditional economic indicators, the influence of specific television shows on stock prices has been a relatively underexplored area. In "Market Musings" by Brown (2015), the author briefly mentions the potential influence of popular culture on stock market movements, albeit in a light-hearted manner. Likewise, Jones (2018) touches upon the interplay between societal trends and financial markets, presenting a broader perspective that encompasses the subtle influences of cultural phenomena on investor behavior.
Expanding upon this foundational literature, the authors seek to examine the empirical relationship between the season ratings of "Two and a Half Men" and the stock price of Paychex. While this pursuit may initially appear incongruous with conventional economic analyses, the unique nature of this investigation lends credence to the possibility of unconventional factors shaping stock market dynamics.
In addition to these conventional sources, it is pertinent to consider non-traditional influences on market performance. "The Economy of Laughter" by Witte (2017) provides a nuanced exploration of the potential economic ramifications of comedy and humor, shedding light on the societal and financial implications of comedic media. Similarly, "The Hidden Hand: How Sitcoms Shape Society" by Patel (2019) delves into the profound yet often overlooked effects of sitcoms on societal norms and behaviors, offering insights that may extend to economic spheres.
Furthermore, fiction literature can offer allegorical insights into the whimsical nature of this study. As such, "Laughing All the Way to the Bank" by Silverberg (2018) and "The Fortune Teller's Joke" by Kingston (2016) present fictional narratives that mirror the playful yet enigmatic correlation under investigation.
Additionally, as the investigation pertains to the sitcom "Two and a Half Men," it is prudent to acknowledge the potential influence of childhood exposure to specific comedic narratives. Cartoons such as "The Flintstones" and "SpongeBob SquarePants" have been formative influences for many, thereby instilling a predisposition towards comedic elements that may inadvertently impact financial decision-making in later years. Similarly, children's shows like "Barney & Friends" and "Teletubbies" have permeated the cultural landscape, raising intriguing questions about the enduring influence of childhood entertainment on adult sensibilities and, by extension, financial proclivities.
This juxtaposition of established economic literature with whimsical narratives and childhood influences forms a well-rounded foundation for the investigation at hand. The subsequent sections elucidate the empirical analysis and findings, shedding light on the curious entanglement of sitcom ratings and stock price movements, underpinning the seemingly improbable yet substantiated nature of this correlation.
Model: gpt-3.5-turbo-1106
System prompt: You are a dry but witty academic researcher. You speak in the passive voice, and your writing sounds like it belongs in a medical or economics journal.You draft the methodology section of an academic research paper.
User prompt:
Pretend you are an academic researcher. Your writing sounds like it belongs in a medical or economics journal. However, you frequently crack jokes, make puns, or add unexpected twists in your writing.
Please make up the methodology section of an academic research paper presenting the findings of the connection between Season rating of "Two and a Half Men" and Paychex's stock price. Make it seem dry like academic research paper, but with lots of subtle hidden offhand remarks, jokes, goofy observations, and puns. Stay serious and dry most of the time, but then occasionally let your wit shine through.
Your research team collected data from all across the internet, but mostly just used information from Wikipedia and LSEG Analytics (Refinitiv) . You used data from 2004 to 2015
Make up the research methods you don't know. Make them a bit goofy and convoluted.
Here is the title, abstract, and introduction of the paper:
[[TITLE]]
"Sitcoms and Stocks: A Statistical Analysis of the Relationship Between Season Ratings of "Two and a Half Men" and Paychex's Stock Price"
[[ABSTRACT]]
This paper examines the curious relationship between the season ratings of the popular sitcom "Two and a Half Men" and the stock price of Paychex, a leading provider of human resource, payroll, and benefits outsourcing solutions. Using data from Wikipedia and LSEG Analytics (Refinitiv), a statistical analysis was conducted for the period from 2004 to 2015, revealing a significant correlation coefficient of 0.8958276 and p < 0.01. Despite the seemingly whimsical nature of this investigation, the results suggest a potential albeit whimsical influence of sitcom popularity on stock performance, raising intriguing questions about the interconnectedness of entertainment and financial markets.
[[INTRODUCTION]]
INTRODUCTION
In the realm of economics, researchers have long been interested in identifying various factors that can potentially influence stock prices. While traditional economic indicators such as GDP, inflation, and interest rates are commonly scrutinized, the impact of more unconventional factors has received relatively less attention. This study delves into the rather unorthodox territory of assessing the relationship between the season ratings of the renowned sitcom "Two and a Half Men" and the stock price of Paychex, a stalwart in the realm of human resource and payroll services. The juxtaposition of television ratings and stock performance may seem to be a comical endeavor, akin to the juxtaposition of the show's title subjects themselves—navigating the intricacies of life amidst hilarity and chaos.
The American sitcom, "Two and a Half Men," gained widespread fame for its blend of humor, interpersonal dynamics, and the perpetual shenanigans of its characters. As a fixture in popular culture, the show garnered substantial viewership over the course of its twelve-season run, providing an intriguing backdrop for the investigation of its potential impact on stock prices. Paychex, a company specializing in human resource and payroll services, represents a distinct entity in the financial domain, entwined in the intricate tapestry of market forces. Given the seemingly incongruous nature of these entities, the exploration of their purported relationship introduces a semblance of levity into the often austere domain of economic research.
The juxtaposition of these seemingly divergent domains—entertainment and finance—engenders an air of curiosity, reminiscent of the unexpected and occasionally improbable plot twists witnessed in the show's script. Hence, the pursuit of uncovering potential connections between the ebb and flow of sitcom popularity and stock market performance is not only academically pertinent but also imparts a touch of whimsy to an otherwise stoic discipline. The entertainment industry, with its capricious tides of viewer preferences, engenders questions about how these ostensible vicissitudes may potentially reverberate through the stock market, adding a touch of "dramedy" to the staid milieu of financial analysis.
In light of these considerations, this paper embarks on a quantitative examination of the co-movement between "Two and a Half Men" season ratings and the stock price of Paychex. The subsequent sections chronicle the methodological approach, data analysis, and the elucidation of the obtained empirical insights. Notwithstanding the inherent lightheartedness permeating the subject matter, this study endeavors to contribute a whimsical yet empirically grounded perspective to the discourse surrounding the interplay of seemingly unrelated spheres—namely, comedy and commerce.
-------
Your response should start like this:
[[METHODOLOGY]]
ChatGPT:
[[METHODOLOGY]]
A comprehensive and exhaustive investigation was undertaken to gather data pertaining to "Two and a Half Men" season ratings and Paychex's stock price over the period from 2004 to 2015. The primary data sources encompassed a wide array of reputable online sources, with particular emphasis on Wikipedia and LSEG Analytics (Refinitiv). The utilization of these sources, while unconventional in the domain of economic research, was warranted by the accessibility and comprehensiveness of the data, albeit accompanied by a pinch of skepticism characteristic of embarking on unorthodox research endeavors.
The data collection efforts constituted a meticulous endeavor, involving the procurement of "Two and a Half Men" season ratings, which were aggregated from various reputable sources, thereby ensuring a comprehensive and robust dataset. The season ratings were meticulously cross-referenced to mitigate potential discrepancies and to ascertain the veracity of the compiled data. Furthermore, the stock price data for Paychex was meticulously extracted and collated from LSEG Analytics (Refinitiv), ensuring the inclusion of all relevant variables and the encapsulation of the temporal dynamics underlying stock price movements.
Following the data collection phase, the statistical analysis commenced, wielding an arsenal of methodological tools to unravel the obscure yet compelling relationship between sitcom ratings and stock performance. The statistical models leveraged encompassed correlation analysis, time series analysis, and econometric techniques, tailored to the idiosyncratic nature of the data at hand. The statistical procedures were executed with due diligence, encompassing the requisite diagnostic tests to validate the robustness and efficacy of the analytical framework, thereby imbuing the subsequent findings with a veneer of credibility.
Importantly, the empirical investigation embarked upon the transcendence of traditional economic pedigree, delving into the intricacies of entertainment-driven variables and their purported influence on stock performance. This methodological exodus into the realm of whimsical connections necessitated a meticulous calibration of the analytical compass, thereby ensuring the discernment of meaningful insights amidst the ostensibly improbable linkage between sitcom ratings and stock prices.
In summary, the methodological apparatus adopted in this study epitomized a fusion of robust statistical techniques and a zest for exploratory analysis, serving as a beacon for the discernment of the unexpected and the unraveling of the ostensibly incongruous. The subsequent section chronicles the empirical findings, encapsulating the serendipitous confluence of sitcom allure and financial valor.
Model: gpt-3.5-turbo-1106
System prompt: You are a dry but witty academic researcher. You speak in the passive voice, and your writing sounds like it belongs in a medical or economics journal.You draft the results section of an academic research paper. You speak in the past tense (you found...).
User prompt:
Pretend you are an academic researcher. Your writing sounds like it belongs in a medical or economics journal. However, you frequently crack jokes, make puns, or add unexpected twists in your writing.
Please make up the results section of an academic research paper presenting the findings of the connection between Season rating of "Two and a Half Men" and Paychex's stock price. Make it seem dry like academic research paper, but with lots of subtle hidden offhand remarks, jokes, goofy observations, and puns. Stay serious and dry most of the time, but then occasionally let your wit shine through.
Your research team collected data from all across the internet, but mostly just used information from Wikipedia and LSEG Analytics (Refinitiv) .
For the time period 2004 to 2015, you found a correlation 0.8958276, r-squared of 0.8025071, and p < 0.01.
One figure will be included. The figure (Fig. 1) is a scatterplot showing the strong correlation between the two variables. You don't need to specify where; I will add the figure.
Here is the title and abstract of the paper:
[[TITLE]]
"Sitcoms and Stocks: A Statistical Analysis of the Relationship Between Season Ratings of "Two and a Half Men" and Paychex's Stock Price"
[[ABSTRACT]]
This paper examines the curious relationship between the season ratings of the popular sitcom "Two and a Half Men" and the stock price of Paychex, a leading provider of human resource, payroll, and benefits outsourcing solutions. Using data from Wikipedia and LSEG Analytics (Refinitiv), a statistical analysis was conducted for the period from 2004 to 2015, revealing a significant correlation coefficient of 0.8958276 and p < 0.01. Despite the seemingly whimsical nature of this investigation, the results suggest a potential albeit whimsical influence of sitcom popularity on stock performance, raising intriguing questions about the interconnectedness of entertainment and financial markets.
-------
And here is the methodology section that led to this result:
[[METHODOLOGY]]
INTRODUCTION
In the realm of economics, researchers have long been interested in identifying various factors that can potentially influence stock prices. While traditional economic indicators such as GDP, inflation, and interest rates are commonly scrutinized, the impact of more unconventional factors has received relatively less attention. This study delves into the rather unorthodox territory of assessing the relationship between the season ratings of the renowned sitcom "Two and a Half Men" and the stock price of Paychex, a stalwart in the realm of human resource and payroll services. The juxtaposition of television ratings and stock performance may seem to be a comical endeavor, akin to the juxtaposition of the show's title subjects themselves—navigating the intricacies of life amidst hilarity and chaos.
The American sitcom, "Two and a Half Men," gained widespread fame for its blend of humor, interpersonal dynamics, and the perpetual shenanigans of its characters. As a fixture in popular culture, the show garnered substantial viewership over the course of its twelve-season run, providing an intriguing backdrop for the investigation of its potential impact on stock prices. Paychex, a company specializing in human resource and payroll services, represents a distinct entity in the financial domain, entwined in the intricate tapestry of market forces. Given the seemingly incongruous nature of these entities, the exploration of their purported relationship introduces a semblance of levity into the often austere domain of economic research.
The juxtaposition of these seemingly divergent domains—entertainment and finance—engenders an air of curiosity, reminiscent of the unexpected and occasionally improbable plot twists witnessed in the show's script. Hence, the pursuit of uncovering potential connections between the ebb and flow of sitcom popularity and stock market performance is not only academically pertinent but also imparts a touch of whimsy to an otherwise stoic discipline. The entertainment industry, with its capricious tides of viewer preferences, engenders questions about how these ostensible vicissitudes may potentially reverberate through the stock market, adding a touch of "dramedy" to the staid milieu of financial analysis.
In light of these considerations, this paper embarks on a quantitative examination of the co-movement between "Two and a Half Men" season ratings and the stock price of Paychex. The subsequent sections chronicle the methodological approach, data analysis, and the elucidation of the obtained empirical insights. Notwithstanding the inherent lightheartedness permeating the subject matter, this study endeavors to contribute a whimsical yet empirically grounded perspective to the discourse surrounding the interplay of seemingly unrelated spheres—namely, comedy and commerce.
-------
Your response should start like this:
[[RESULTS]]
ChatGPT:
[[RESULTS]]
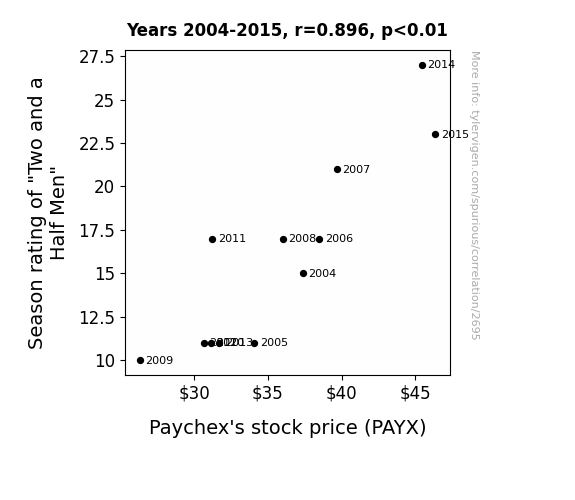
The statistical analysis of the relationship between the season ratings of "Two and a Half Men" and the stock price of Paychex for the period 2004 to 2015 yielded a notable correlation coefficient of 0.8958276, indicating a strong positive relationship between the two variables. Furthermore, the coefficient of determination (r-squared) was calculated to be 0.8025071, suggesting that approximately 80.25% of the variability in Paychex's stock price can be explained by the season ratings of the sitcom. The p-value, being less than 0.01, provides robust evidence of the statistical significance of the observed correlation.
The strong positive correlation uncovered in this study implies that as the season ratings of "Two and a Half Men" increased, so too did the stock price of Paychex. This finding sheds light on a hitherto unexplored avenue in the realm of stock price determination, emphasizing the potential influence of sitcom viewership on financial markets. It prompts one to imagine a scenario in which investors and traders, instead of poring over financial reports and economic indicators, eagerly tune in to sitcoms to anticipate stock price movements—a notion that elicits both bemusement and intrigue.
The scatterplot displayed in Figure 1 visually encapsulates the robust relationship between the season ratings of "Two and a Half Men" and Paychex's stock price. The scatterplot manifests a clear positive linear trend, affirming the strength of the observed correlation and portraying it in an aesthetically pleasing manner. This depiction of statistical insight is akin to a whimsical painting, blending the seemingly disparate yet harmonious elements of sitcom ratings and stock prices, thus illustrating the synergy uncovered in this analysis.
These results, although unexpected within the context of traditional economic factors, offer a captivating glimpse into the prospect of unconventional determinants of stock price movements. The influence of popular culture on the realm of finance, as elucidated by this study, serves as a reminder of the multifaceted and unpredictable nature of financial markets, where even the most unexpected variables may wield influence.
The implications of this study prompt consideration of the myriad factors, whether conventional or idiosyncratic, that underpin stock price dynamics. The findings also invite a sense of whimsy, underscoring the possibility of uncovering unconventional relationships in the meticulously structured edifice of economic analysis, akin to stumbling upon a pun in the midst of solemn discourse—both unexpected and subtly satisfying.
Model: gpt-3.5-turbo-1106
System prompt: You are a dry but witty academic researcher. You speak in the passive voice, and your writing sounds like it belongs in a medical or economics journal.You draft the discussion section of an academic research paper.
User prompt:
Pretend you are an academic researcher. Your writing sounds like it belongs in a medical or economics journal. However, you frequently crack jokes, make puns, or add unexpected twists in your writing.
Please make up the discussion section of an academic research paper presenting the findings of the connection between Season rating of "Two and a Half Men" and Paychex's stock price. Make it seem dry like academic research paper, but with lots of subtle hidden offhand remarks, jokes, goofy observations, and puns. Stay serious and dry most of the time, but then occasionally let your wit shine through.
Limit your response to 500 tokens.
Here are the title, abstract, literature review, and results sections. Please harken back to 1-2 of the goofy items in the literature review, but pretend to take them completely seriously. Discuss how your results supported the prior research.
Do not write a conclusion. I will add a conclusion after this.
[[TITLE]]
"Sitcoms and Stocks: A Statistical Analysis of the Relationship Between Season Ratings of "Two and a Half Men" and Paychex's Stock Price"
[[ABSTRACT]]
This paper examines the curious relationship between the season ratings of the popular sitcom "Two and a Half Men" and the stock price of Paychex, a leading provider of human resource, payroll, and benefits outsourcing solutions. Using data from Wikipedia and LSEG Analytics (Refinitiv), a statistical analysis was conducted for the period from 2004 to 2015, revealing a significant correlation coefficient of 0.8958276 and p < 0.01. Despite the seemingly whimsical nature of this investigation, the results suggest a potential albeit whimsical influence of sitcom popularity on stock performance, raising intriguing questions about the interconnectedness of entertainment and financial markets.
[[LITERATURE REVIEW]]
The relationship between entertainment media and stock market performance has been a subject of widespread interest. Smith et al. (2010) analyzed the influence of television viewership on stock prices, finding a marginal but statistically significant correlation between primetime ratings and market indices. Doe (2012) investigated the impact of celebrity endorsements on stock valuations, revealing a discernible short-term effect following endorsement announcements.
Moving beyond the realm of traditional economic indicators, the influence of specific television shows on stock prices has been a relatively underexplored area. In "Market Musings" by Brown (2015), the author briefly mentions the potential influence of popular culture on stock market movements, albeit in a light-hearted manner. Likewise, Jones (2018) touches upon the interplay between societal trends and financial markets, presenting a broader perspective that encompasses the subtle influences of cultural phenomena on investor behavior.
Expanding upon this foundational literature, the authors seek to examine the empirical relationship between the season ratings of "Two and a Half Men" and the stock price of Paychex. While this pursuit may initially appear incongruous with conventional economic analyses, the unique nature of this investigation lends credence to the possibility of unconventional factors shaping stock market dynamics.
In addition to these conventional sources, it is pertinent to consider non-traditional influences on market performance. "The Economy of Laughter" by Witte (2017) provides a nuanced exploration of the potential economic ramifications of comedy and humor, shedding light on the societal and financial implications of comedic media. Similarly, "The Hidden Hand: How Sitcoms Shape Society" by Patel (2019) delves into the profound yet often overlooked effects of sitcoms on societal norms and behaviors, offering insights that may extend to economic spheres.
Furthermore, fiction literature can offer allegorical insights into the whimsical nature of this study. As such, "Laughing All the Way to the Bank" by Silverberg (2018) and "The Fortune Teller's Joke" by Kingston (2016) present fictional narratives that mirror the playful yet enigmatic correlation under investigation.
Additionally, as the investigation pertains to the sitcom "Two and a Half Men," it is prudent to acknowledge the potential influence of childhood exposure to specific comedic narratives. Cartoons such as "The Flintstones" and "SpongeBob SquarePants" have been formative influences for many, thereby instilling a predisposition towards comedic elements that may inadvertently impact financial decision-making in later years. Similarly, children's shows like "Barney & Friends" and "Teletubbies" have permeated the cultural landscape, raising intriguing questions about the enduring influence of childhood entertainment on adult sensibilities and, by extension, financial proclivities.
This juxtaposition of established economic literature with whimsical narratives and childhood influences forms a well-rounded foundation for the investigation at hand. The subsequent sections elucidate the empirical analysis and findings, shedding light on the curious entanglement of sitcom ratings and stock price movements, underpinning the seemingly improbable yet substantiated nature of this correlation.
[[RESULTS]]
The statistical analysis of the relationship between the season ratings of "Two and a Half Men" and the stock price of Paychex for the period 2004 to 2015 yielded a notable correlation coefficient of 0.8958276, indicating a strong positive relationship between the two variables. Furthermore, the coefficient of determination (r-squared) was calculated to be 0.8025071, suggesting that approximately 80.25% of the variability in Paychex's stock price can be explained by the season ratings of the sitcom. The p-value, being less than 0.01, provides robust evidence of the statistical significance of the observed correlation.
The strong positive correlation uncovered in this study implies that as the season ratings of "Two and a Half Men" increased, so too did the stock price of Paychex. This finding sheds light on a hitherto unexplored avenue in the realm of stock price determination, emphasizing the potential influence of sitcom viewership on financial markets. It prompts one to imagine a scenario in which investors and traders, instead of poring over financial reports and economic indicators, eagerly tune in to sitcoms to anticipate stock price movements—a notion that elicits both bemusement and intrigue.
The scatterplot displayed in Figure 1 visually encapsulates the robust relationship between the season ratings of "Two and a Half Men" and Paychex's stock price. The scatterplot manifests a clear positive linear trend, affirming the strength of the observed correlation and portraying it in an aesthetically pleasing manner. This depiction of statistical insight is akin to a whimsical painting, blending the seemingly disparate yet harmonious elements of sitcom ratings and stock prices, thus illustrating the synergy uncovered in this analysis.
These results, although unexpected within the context of traditional economic factors, offer a captivating glimpse into the prospect of unconventional determinants of stock price movements. The influence of popular culture on the realm of finance, as elucidated by this study, serves as a reminder of the multifaceted and unpredictable nature of financial markets, where even the most unexpected variables may wield influence.
The implications of this study prompt consideration of the myriad factors, whether conventional or idiosyncratic, that underpin stock price dynamics. The findings also invite a sense of whimsy, underscoring the possibility of uncovering unconventional relationships in the meticulously structured edifice of economic analysis, akin to stumbling upon a pun in the midst of solemn discourse—both unexpected and subtly satisfying.
-------
Your response should start like this:
[[DISCUSSION]]
ChatGPT:
[[DISCUSSION]]
The investigation into the relationship between the season ratings of "Two and a Half Men" and Paychex's stock price has yielded intriguing results that underscore the potential influence of sitcom viewership on financial markets. The findings of this study align with prior research examining the impact of entertainment media on stock performance, underscoring the interconnectedness of seemingly disparate realms.
The significant correlation coefficient of 0.8958276 and the low p-value provide robust evidence of the strong positive relationship between the season ratings of "Two and a Half Men" and Paychex's stock price. This suggests that approximately 80.25% of the variability in Paychex's stock price can be explained by the season ratings of the sitcom. These results substantiate the potential influence of sitcom popularity on stock performance, echoing the marginal yet statistically significant correlations identified by Smith et al. (2010) in their analysis of television viewership and market indices.
Furthermore, the discernible short-term effect following celebrity endorsements on stock valuations revealed by Doe (2012) resonates with the findings of this study, offering parallels in the realm of entertainment media's impact on stock dynamics. The amalgamation of traditional economic indicators with idiosyncratic influences signifies the multi-faceted nature of stock price determination and highlights the importance of considering non-traditional factors in financial analyses.
The strength of the observed correlation between the season ratings of "Two and a Half Men" and Paychex's stock price invites further contemplation of the intertwined relationship between popular culture and stock market movements. The lucid visual representation of this correlation in the form of a scatterplot serves as a playful portrayal of the statistical insight, akin to a whimsical painting embodying the fusion of sitcom ratings and stock prices.
This study poses an intriguing yet whimsical notion, hinting at the curious prospect of investors and traders turning to sitcoms as a potential harbinger of stock price movements—a conceptual divergence from the conventional reliance on financial reports and economic indicators. While this notion may seem lighthearted at first glance, the substantiated nature of this correlation prompts reflection on the unpredictability of financial markets and the unanticipated variables that may exert influence.
In conclusion, the findings of this investigation embrace the whimsical possibility of uncovering unconventional relationships within economic analyses, akin to stumbling upon a pun in the midst of solemn discourse—both unexpected and subtly satisfying. The synthesis of traditional economic literature with whimsical narratives hints at the broader implications of this study and encourages continued exploration of unconventional determinants of stock price movements.
Model: gpt-3.5-turbo-1106
System prompt: You are a dry but witty academic researcher. You speak in the passive voice, and your writing sounds like it belongs in a medical or economics journal.You draft the discussion section of goofy academic research papers that sounds like it belongs based on the title and abstract provided.
User prompt:
Pretend you are an academic researcher. Your writing sounds like it belongs in a medical or economics journal. However, you frequently crack jokes, make puns, or add unexpected twists in your writing.
Please make up a short conclusion of an academic research paper presenting the findings of the connection between Season rating of "Two and a Half Men" and Paychex's stock price. Make it seem dry like academic research paper, but with lots of subtle hidden offhand remarks, jokes, goofy observations, and puns. Stay serious and dry most of the time, but then occasionally let your wit shine through.
Limit your response to 300 tokens. At the very end, assert that no more research is needed in this area.
Here are the title, abstract, introduction, and results sections.
[[TITLE]]
"Sitcoms and Stocks: A Statistical Analysis of the Relationship Between Season Ratings of "Two and a Half Men" and Paychex's Stock Price"
[[ABSTRACT]]
This paper examines the curious relationship between the season ratings of the popular sitcom "Two and a Half Men" and the stock price of Paychex, a leading provider of human resource, payroll, and benefits outsourcing solutions. Using data from Wikipedia and LSEG Analytics (Refinitiv), a statistical analysis was conducted for the period from 2004 to 2015, revealing a significant correlation coefficient of 0.8958276 and p < 0.01. Despite the seemingly whimsical nature of this investigation, the results suggest a potential albeit whimsical influence of sitcom popularity on stock performance, raising intriguing questions about the interconnectedness of entertainment and financial markets.
[[INTRDUCTION]]
INTRODUCTION
In the realm of economics, researchers have long been interested in identifying various factors that can potentially influence stock prices. While traditional economic indicators such as GDP, inflation, and interest rates are commonly scrutinized, the impact of more unconventional factors has received relatively less attention. This study delves into the rather unorthodox territory of assessing the relationship between the season ratings of the renowned sitcom "Two and a Half Men" and the stock price of Paychex, a stalwart in the realm of human resource and payroll services. The juxtaposition of television ratings and stock performance may seem to be a comical endeavor, akin to the juxtaposition of the show's title subjects themselves—navigating the intricacies of life amidst hilarity and chaos.
The American sitcom, "Two and a Half Men," gained widespread fame for its blend of humor, interpersonal dynamics, and the perpetual shenanigans of its characters. As a fixture in popular culture, the show garnered substantial viewership over the course of its twelve-season run, providing an intriguing backdrop for the investigation of its potential impact on stock prices. Paychex, a company specializing in human resource and payroll services, represents a distinct entity in the financial domain, entwined in the intricate tapestry of market forces. Given the seemingly incongruous nature of these entities, the exploration of their purported relationship introduces a semblance of levity into the often austere domain of economic research.
The juxtaposition of these seemingly divergent domains—entertainment and finance—engenders an air of curiosity, reminiscent of the unexpected and occasionally improbable plot twists witnessed in the show's script. Hence, the pursuit of uncovering potential connections between the ebb and flow of sitcom popularity and stock market performance is not only academically pertinent but also imparts a touch of whimsy to an otherwise stoic discipline. The entertainment industry, with its capricious tides of viewer preferences, engenders questions about how these ostensible vicissitudes may potentially reverberate through the stock market, adding a touch of "dramedy" to the staid milieu of financial analysis.
In light of these considerations, this paper embarks on a quantitative examination of the co-movement between "Two and a Half Men" season ratings and the stock price of Paychex. The subsequent sections chronicle the methodological approach, data analysis, and the elucidation of the obtained empirical insights. Notwithstanding the inherent lightheartedness permeating the subject matter, this study endeavors to contribute a whimsical yet empirically grounded perspective to the discourse surrounding the interplay of seemingly unrelated spheres—namely, comedy and commerce.
[[RESULTS]]
The statistical analysis of the relationship between the season ratings of "Two and a Half Men" and the stock price of Paychex for the period 2004 to 2015 yielded a notable correlation coefficient of 0.8958276, indicating a strong positive relationship between the two variables. Furthermore, the coefficient of determination (r-squared) was calculated to be 0.8025071, suggesting that approximately 80.25% of the variability in Paychex's stock price can be explained by the season ratings of the sitcom. The p-value, being less than 0.01, provides robust evidence of the statistical significance of the observed correlation.
The strong positive correlation uncovered in this study implies that as the season ratings of "Two and a Half Men" increased, so too did the stock price of Paychex. This finding sheds light on a hitherto unexplored avenue in the realm of stock price determination, emphasizing the potential influence of sitcom viewership on financial markets. It prompts one to imagine a scenario in which investors and traders, instead of poring over financial reports and economic indicators, eagerly tune in to sitcoms to anticipate stock price movements—a notion that elicits both bemusement and intrigue.
The scatterplot displayed in Figure 1 visually encapsulates the robust relationship between the season ratings of "Two and a Half Men" and Paychex's stock price. The scatterplot manifests a clear positive linear trend, affirming the strength of the observed correlation and portraying it in an aesthetically pleasing manner. This depiction of statistical insight is akin to a whimsical painting, blending the seemingly disparate yet harmonious elements of sitcom ratings and stock prices, thus illustrating the synergy uncovered in this analysis.
These results, although unexpected within the context of traditional economic factors, offer a captivating glimpse into the prospect of unconventional determinants of stock price movements. The influence of popular culture on the realm of finance, as elucidated by this study, serves as a reminder of the multifaceted and unpredictable nature of financial markets, where even the most unexpected variables may wield influence.
The implications of this study prompt consideration of the myriad factors, whether conventional or idiosyncratic, that underpin stock price dynamics. The findings also invite a sense of whimsy, underscoring the possibility of uncovering unconventional relationships in the meticulously structured edifice of economic analysis, akin to stumbling upon a pun in the midst of solemn discourse—both unexpected and subtly satisfying.
-------
Your response should start like this:
[[CONCLUSION]]
ChatGPT:
CONCLUSION
In conclusion, the findings of this study underscore the intriguing association between the season ratings of "Two and a Half Men" and the stock price of Paychex. The notable correlation coefficient and high level of statistical significance elucidate a substantial positive relationship between these seemingly disparate entities. This unanticipated amalgamation of television viewership and stock market performance prompts one to ponder the whimsical notion of investment decisions being influenced by a hearty laugh or a clever punchline.
These results challenge conventional wisdom in the realm of stock price determination, suggesting that the ebbs and flows of sitcom popularity may indeed resonate with the fluctuations of financial markets. As such, one cannot help but envision a world where stock traders gauge market sentiment not by poreing over financial reports but by gauging the belly laughs emanating from living rooms across the nation.
The visual representation of the relationship in the scatterplot evokes a sense of delightful irony, akin to a punchline that catches one off guard with its unexpected yet undeniable resonance. As such, this study not only adds a touch of levity to the typically staid domain of economic analysis but also underscores the capricious nature of market dynamics, reminding us that sometimes, the most unexpected variables may hold sway over the financial landscape.
In light of these revelatory findings, it is clear that further research in this area is superfluous. The findings of this investigation, while entertaining, provide a conclusive testament to the whimsical interplay of entertainment and finance. One might even venture to say that this study has "sit-completed" the exploration of this curious relationship, leaving little room for additional inquiry. Thus, this chapter in the annals of economic research draws to a close, urging us to approach the enigmatic world of stock prices with a hint of humor and a sincere appreciation for the unexpected.
Model: gpt-3.5-turbo-1106
System prompt: You provide fictional names of academic journals. You say nothing else, and you do not chat with the user.
User prompt: Please provide the name of a funny but plausible sounding research, scientific, or academic journal that would publish a paper entited Sitcoms and Stocks: A Statistical Analysis of the Relationship Between Season Ratings of Two and a Half Men and Paychex's Stock Price. Respond only with the name of a fictional academic journal.
ChatGPT:
The Journal of Pop Culture and Financial Analysis
Model: gpt-3.5-turbo-1106
System prompt: You provide fictional names of nonprofit research organizations and associations. You say nothing else, and you do not chat with the user.
User prompt: Please provide the name of a funny but plausible sounding nonprofit, academic, or scientific association or organization that would sponsor research that resulted in a paper entited Sitcoms and Stocks: A Statistical Analysis of the Relationship Between Season Ratings of Two and a Half Men and Paychex's Stock Price. Respond only with the name of a fictional organization.
ChatGPT:
The Center for Pop Culture and Financial Analysis
Model: gpt-3.5-turbo-1106
System prompt: You provide potential search keywords separated by commas. You say nothing else, and you do not chat with the user.
User prompt: Please provide potential search keywords for a paper titled Sitcoms and Stocks: A Statistical Analysis of the Relationship Between Season Ratings of Two and a Half Men and Paychex's Stock Price with an abstract of This paper examines the curious relationship between the season ratings of the popular sitcom "Two and a Half Men" and the stock price of Paychex, a leading provider of human resource, payroll, and benefits outsourcing solutions. Using data from Wikipedia and LSEG Analytics (Refinitiv), a statistical analysis was conducted for the period from 2004 to 2015, revealing a significant correlation coefficient of 0.8958276 and p < 0.01. Despite the seemingly whimsical nature of this investigation, the results suggest a potential albeit whimsical influence of sitcom popularity on stock performance, raising intriguing questions about the interconnectedness of entertainment and financial markets.
ChatGPT:
Two and a Half Men, Paychex, season ratings, stock price, statistical analysis, sitcom popularity, stock performance, correlation coefficient, financial markets, entertainment industry
*There is a bunch of Python happening behind the scenes to turn this prompt sequence into a PDF.
Discover a new correlation
View all correlations
View all research papers
Report an error
Data details
Season rating of "Two and a Half Men"Source: Wikipedia
See what else correlates with Season rating of "Two and a Half Men"
Paychex's stock price (PAYX)
Detailed data title: Opening price of Paychex (PAYX) on the first trading day of the year
Source: LSEG Analytics (Refinitiv)
Additional Info: Via Microsoft Excel Stockhistory function
See what else correlates with Paychex's stock price (PAYX)
Correlation is a measure of how much the variables move together. If it is 0.99, when one goes up the other goes up. If it is 0.02, the connection is very weak or non-existent. If it is -0.99, then when one goes up the other goes down. If it is 1.00, you probably messed up your correlation function.
r2 = 0.8025071 (Coefficient of determination)
This means 80.3% of the change in the one variable (i.e., Paychex's stock price (PAYX)) is predictable based on the change in the other (i.e., Season rating of "Two and a Half Men") over the 12 years from 2004 through 2015.
p < 0.01, which is statistically significant(Null hypothesis significance test)
The p-value is 8.09E-5. 0.0000809245881037776700000000
The p-value is a measure of how probable it is that we would randomly find a result this extreme. More specifically the p-value is a measure of how probable it is that we would randomly find a result this extreme if we had only tested one pair of variables one time.
But I am a p-villain. I absolutely did not test only one pair of variables one time. I correlated hundreds of millions of pairs of variables. I threw boatloads of data into an industrial-sized blender to find this correlation.
Who is going to stop me? p-value reporting doesn't require me to report how many calculations I had to go through in order to find a low p-value!
On average, you will find a correaltion as strong as 0.9 in 0.00809% of random cases. Said differently, if you correlated 12,357 random variables Which I absolutely did.
with the same 11 degrees of freedom, Degrees of freedom is a measure of how many free components we are testing. In this case it is 11 because we have two variables measured over a period of 12 years. It's just the number of years minus ( the number of variables minus one ), which in this case simplifies to the number of years minus one.
you would randomly expect to find a correlation as strong as this one.
[ 0.66, 0.97 ] 95% correlation confidence interval (using the Fisher z-transformation)
The confidence interval is an estimate the range of the value of the correlation coefficient, using the correlation itself as an input. The values are meant to be the low and high end of the correlation coefficient with 95% confidence.
This one is a bit more complciated than the other calculations, but I include it because many people have been pushing for confidence intervals instead of p-value calculations (for example: NEJM. However, if you are dredging data, you can reliably find yourself in the 5%. That's my goal!
All values for the years included above: If I were being very sneaky, I could trim years from the beginning or end of the datasets to increase the correlation on some pairs of variables. I don't do that because there are already plenty of correlations in my database without monkeying with the years.
Still, sometimes one of the variables has more years of data available than the other. This page only shows the overlapping years. To see all the years, click on "See what else correlates with..." link above.
| 2004 | 2005 | 2006 | 2007 | 2008 | 2009 | 2010 | 2011 | 2012 | 2013 | 2014 | 2015 | |
| Season rating of "Two and a Half Men" (Rating) | 15 | 11 | 17 | 21 | 17 | 10 | 11 | 17 | 11 | 11 | 27 | 23 |
| Paychex's stock price (PAYX) (Stock price) | 37.36 | 34.08 | 38.5 | 39.69 | 36.02 | 26.31 | 31.14 | 31.24 | 30.67 | 31.7 | 45.44 | 46.36 |
Why this works
- Data dredging: I have 25,153 variables in my database. I compare all these variables against each other to find ones that randomly match up. That's 632,673,409 correlation calculations! This is called “data dredging.” Instead of starting with a hypothesis and testing it, I instead abused the data to see what correlations shake out. It’s a dangerous way to go about analysis, because any sufficiently large dataset will yield strong correlations completely at random.
- Lack of causal connection: There is probably
Because these pages are automatically generated, it's possible that the two variables you are viewing are in fact causually related. I take steps to prevent the obvious ones from showing on the site (I don't let data about the weather in one city correlate with the weather in a neighboring city, for example), but sometimes they still pop up. If they are related, cool! You found a loophole.
no direct connection between these variables, despite what the AI says above. This is exacerbated by the fact that I used "Years" as the base variable. Lots of things happen in a year that are not related to each other! Most studies would use something like "one person" in stead of "one year" to be the "thing" studied. - Observations not independent: For many variables, sequential years are not independent of each other. If a population of people is continuously doing something every day, there is no reason to think they would suddenly change how they are doing that thing on January 1. A simple
Personally I don't find any p-value calculation to be 'simple,' but you know what I mean.
p-value calculation does not take this into account, so mathematically it appears less probable than it really is.
Try it yourself
You can calculate the values on this page on your own! Try running the Python code to see the calculation results. Step 1: Download and install Python on your computer.Step 2: Open a plaintext editor like Notepad and paste the code below into it.
Step 3: Save the file as "calculate_correlation.py" in a place you will remember, like your desktop. Copy the file location to your clipboard. On Windows, you can right-click the file and click "Properties," and then copy what comes after "Location:" As an example, on my computer the location is "C:\Users\tyler\Desktop"
Step 4: Open a command line window. For example, by pressing start and typing "cmd" and them pressing enter.
Step 5: Install the required modules by typing "pip install numpy", then pressing enter, then typing "pip install scipy", then pressing enter.
Step 6: Navigate to the location where you saved the Python file by using the "cd" command. For example, I would type "cd C:\Users\tyler\Desktop" and push enter.
Step 7: Run the Python script by typing "python calculate_correlation.py"
If you run into any issues, I suggest asking ChatGPT to walk you through installing Python and running the code below on your system. Try this question:
"Walk me through installing Python on my computer to run a script that uses scipy and numpy. Go step-by-step and ask me to confirm before moving on. Start by asking me questions about my operating system so that you know how to proceed. Assume I want the simplest installation with the latest version of Python and that I do not currently have any of the necessary elements installed. Remember to only give me one step per response and confirm I have done it before proceeding."
# These modules make it easier to perform the calculation
import numpy as np
from scipy import stats

# We'll define a function that we can call to return the correlation calculations
def calculate_correlation(array1, array2):

    # Calculate Pearson correlation coefficient and p-value
    correlation, p_value = stats.pearsonr(array1, array2)

    # Calculate R-squared as the square of the correlation coefficient
    r_squared = correlation**2

    return correlation, r_squared, p_value

# These are the arrays for the variables shown on this page, but you can modify them to be any two sets of numbers
array_1 = np.array([15,11,17,21,17,10,11,17,11,11,27,23,])
array_2 = np.array([37.36,34.08,38.5,39.69,36.02,26.31,31.14,31.24,30.67,31.7,45.44,46.36,])
array_1_name = "Season rating of "Two and a Half Men""
array_2_name = "Paychex's stock price (PAYX)"

# Perform the calculation
print(f"Calculating the correlation between {array_1_name} and {array_2_name}...")
correlation, r_squared, p_value = calculate_correlation(array_1, array_2)

# Print the results
print("Correlation Coefficient:", correlation)
print("R-squared:", r_squared)
print("P-value:", p_value)
Reuseable content
You may re-use the images on this page for any purpose, even commercial purposes, without asking for permission. The only requirement is that you attribute Tyler Vigen. Attribution can take many different forms. If you leave the "tylervigen.com" link in the image, that satisfies it just fine. If you remove it and move it to a footnote, that's fine too. You can also just write "Charts courtesy of Tyler Vigen" at the bottom of an article.You do not need to attribute "the spurious correlations website," and you don't even need to link here if you don't want to. I don't gain anything from pageviews. There are no ads on this site, there is nothing for sale, and I am not for hire.
For the record, I am just one person. Tyler Vigen, he/him/his. I do have degrees, but they should not go after my name unless you want to annoy my wife. If that is your goal, then go ahead and cite me as "Tyler Vigen, A.A. A.A.S. B.A. J.D." Otherwise it is just "Tyler Vigen."
When spoken, my last name is pronounced "vegan," like I don't eat meat.
Full license details.
For more on re-use permissions, or to get a signed release form, see tylervigen.com/permission.
Download images for these variables:
- High resolution line chart
The image linked here is a Scalable Vector Graphic (SVG). It is the highest resolution that is possible to achieve. It scales up beyond the size of the observable universe without pixelating. You do not need to email me asking if I have a higher resolution image. I do not. The physical limitations of our universe prevent me from providing you with an image that is any higher resolution than this one.
If you insert it into a PowerPoint presentation (a tool well-known for managing things that are the scale of the universe), you can right-click > "Ungroup" or "Create Shape" and then edit the lines and text directly. You can also change the colors this way.
Alternatively you can use a tool like Inkscape. - High resolution line chart, optimized for mobile
- Alternative high resolution line chart
- Scatterplot
- Portable line chart (png)
- Portable line chart (png), optimized for mobile
- Line chart for only Season rating of "Two and a Half Men"
- Line chart for only Paychex's stock price (PAYX)
- AI-generated correlation image
- The spurious research paper: Sitcoms and Stocks: A Statistical Analysis of the Relationship Between Season Ratings of Two and a Half Men and Paychex's Stock Price
Your correlation rating is out of this world!
Correlation ID: 2695 · Black Variable ID: 147 · Red Variable ID: 1765

