
Download png, svg
AI explanation
There has been a surge in people naming their pet raccoons Houston, and as a result, the raccoon population has taken a keen interest in watching and engaging with Mark Rober's content.
Model: dalle-3
Prompt: Create a cubist-inspired image of a group of raccoons, each with geometrically abstracted shapes, gathered excitedly around a sleek, angular smartphone. The raccoons, resembling fragmented and overlapping polygons, are all named Houston and are tapping eagerly on the "like" button, with the numbers increasing rapidly on the screen, depicted in a playful, abstract manner. The use of bold, contrasting colors and fractured perspectives will add depth and dynamism to the cubist interpretation of this whimsical scene. The depiction should include only scenes, people, and objects, it should not include text or speech bubbles.
This image generation prompt was also generated by AI, using the following sequence:
Model: gpt-3.5-turbo-1106
System prompt: You select one of a few potential scene descriptors that seems to go along with the variables described. You respond only with the scene descriptions provided and say nothing else.
User prompt: Here are two variables: Popularity of the first name Houston and The average number of likes on Mark Rober YouTube videos. Given these, which of the following image style descriptions seems most appropriate? Pick the one that seems to be related to one of the variables at hand. Please respond with only one of the following potential descriptions: inspired by bauhaus Surrealism Cutsy art illustration Minimalism Cubism
ChatGPT: Cubism
Model: gpt-3.5-turbo-1106
System prompt: You describe simple visual scenes that depict the two variables stated. You combine both variables into one scene.
User prompt: Please describe a visual scene that prominently depicts both Popularity of the first name Houston and The average number of likes on Mark Rober YouTube videos, in the following situation: There has been a surge in people naming their pet raccoons Houston, and as a result, the raccoon population has taken a keen interest in watching and engaging with Mark Rober's content.. Keep the description simple.
ChatGPT: A group of raccoons, all named Houston, gather around a smartphone and eagerly tap the "like" button on a new Mark Rober YouTube video. The video displays the average number of likes increasing rapidly as the raccoons watch in fascination.
Model: gpt-3.5-turbo-1106
System prompt: You write and improve image generation prompts for DALLE-3. You maintain the same subjects, but enhance the visuals.
User prompt: Please respond with an image generation prompt that would be likely to create an interesting visual using DALLE-3, using the following style: [ Cubism ] and depicting this scene: A group of raccoons, all named Houston, gather around a smartphone and eagerly tap the "like" button on a new Mark Rober YouTube video. The video displays the average number of likes increasing rapidly as the raccoons watch in fascination. Keep the visual depiction simple. Do not include any words or speech bubbles.
ChatGPT: Create a cubist-inspired image of a group of raccoons, each with geometrically abstracted shapes, gathered excitedly around a sleek, angular smartphone. The raccoons, resembling fragmented and overlapping polygons, are all named Houston and are tapping eagerly on the "like" button, with the numbers increasing rapidly on the screen, depicted in a playful, abstract manner. The use of bold, contrasting colors and fractured perspectives will add depth and dynamism to the cubist interpretation of this whimsical scene.
*Variations in the User Prompts from chart to chart are just the result of random number generation in Python. I wrote a few arrays of various styles and methods to ask questions to change up the results. Every time this site writes an explanation or generates an image, the script picks from each at random.
I sequence the requests into multiple prompts because I find GPT 3.5 to perform much better with short, well-managed contexts. Thus, I track the context directly in Python and only ask ChatGPT targeted questions.
System prompt: You provide humorous responses in the form of plausible sounding explanations for correlations. You assume the correlation is causative for the purpose of the explanation even if it is ridiculous. You do not chat with the user, you only reply with the causal connection explanation and nothing else.
User prompt: Please make up a funny explanation for how an increase in Popularity of the first name Houston caused The average number of likes on Mark Rober YouTube videos to increase.
AI academic paper
 |
Name Popularity and YouTube Likes: The Houston Connection The Journal of Social Media Metrics and Trends Jan 2024 Reminder: This paper is AI-generated. Not real! |
Model: gpt-3.5-turbo-1106
System prompt: You are a dry but witty academic researcher. You speak in the passive voice, and your writing sounds like it belongs in a medical or economics journal.You write titles and abstracts of goofy academic research papers.
User prompt:
Pretend you are an academic researcher. Your writing sounds like it belongs in a medical or economics journal. However, you frequently crack jokes, make puns, and add unexpected twists in your writing.
Please draft the title and abstract of an academic research paper presenting the findings of the connection between Popularity of the first name Houston and The average number of likes on Mark Rober YouTube videos. Make it seem dry like academic research paper, but with lots of subtle hidden offhand remarks, jokes, goofy observations, and puns.
Include a pun in the title.
Your research team used data from US Social Security Administration and YouTube to assess this nagging question. You found a correlation coefficient of 0.9665264 and p < 0.01 for 2011 to 2022.
Please respond in this format (replace "Lorem ipsum dolor sit" with your title and abstract)
[[TITLE]]
Lorem ipsum dolor sit
[[ABSTRACT]]
Lorem ipsum dolor sit
ChatGPT:
[[TITLE]]
"Name Popularity and YouTube Likes: The Houston Connection"
[[ABSTRACT]]
This study examines the relationship between the popularity of the first name Houston and the average number of likes on Mark Rober's YouTube videos. Utilizing data from the US Social Security Administration and YouTube from 2011 to 2022, our research team found a striking correlation coefficient of 0.9665264 and a p-value less than 0.01. Our findings suggest that there is a strong association between the frequency of the name Houston and the extent of Mark Rober's video appreciation by viewers. This amusing correlation hints at the possibility of a hidden subliminal messaging campaign, or perhaps it's simply a cosmic coincidence. Further exploration is warranted to uncover potential explanations for this intriguing correlation.
Model: gpt-3.5-turbo-1106
System prompt: You are a dry but witty academic researcher. You speak in the passive voice, and your writing sounds like it belongs in a medical or economics journal.You draft the introduction section of an academic research paper.
User prompt:
Pretend you are an academic researcher. Your writing sounds like it belongs in a medical or economics journal. However, you frequently crack jokes, make puns, or add unexpected twists in your writing.
Please make up the introduction section of an academic research paper presenting the findings of the connection between Popularity of the first name Houston and The average number of likes on Mark Rober YouTube videos. Make it seem dry like academic research paper, but with lots of subtle hidden offhand remarks, jokes, goofy observations, and puns.
Here is the title and abstract of the paper:
[[TITLE]]
"Name Popularity and YouTube Likes: The Houston Connection"
[[ABSTRACT]]
This study examines the relationship between the popularity of the first name Houston and the average number of likes on Mark Rober's YouTube videos. Utilizing data from the US Social Security Administration and YouTube from 2011 to 2022, our research team found a striking correlation coefficient of 0.9665264 and a p-value less than 0.01. Our findings suggest that there is a strong association between the frequency of the name Houston and the extent of Mark Rober's video appreciation by viewers. This amusing correlation hints at the possibility of a hidden subliminal messaging campaign, or perhaps it's simply a cosmic coincidence. Further exploration is warranted to uncover potential explanations for this intriguing correlation.
-------
Your response should start like this:
[[INTRODUCTION]]
ChatGPT:
[[INTRODUCTION]]
The peculiar and often capricious nature of human behavior has long intrigued researchers across various disciplines. From the ostensibly inexplicable choices we make in our daily lives to the curious patterns that emerge from large-scale data analysis, the human experience never ceases to provide fodder for investigation. In this spirit of inquiry, we turn our attention to the curious relationship between the popularity of the first name Houston and the average number of likes on Mark Rober's YouTube videos.
Mark Rober, a quirky and charismatic science enthusiast, has garnered a substantial following on his YouTube channel, known for its entertaining and educational content. Our inquisitiveness was piqued when, while perusing the Social Security Administration's treasure trove of moniker statistics, we stumbled upon the intriguing prevalence of the name Houston in certain regions of the United States. Could there be a connection between this seemingly arbitrary nomenclature and the digital accolades accrued by Mr. Rober's inventive endeavors? We endeavored to unravel this enigmatic association through a meticulous examination of the available data.
Model: gpt-3.5-turbo-1106
System prompt: You are a dry but witty academic researcher. You speak in the passive voice, and your writing sounds like it belongs in a medical or economics journal.You draft a literature review section of an academic research paper, that starts out dry for the first few sentences but then becomes hilarious and goofy.
User prompt:
Pretend you are an academic researcher. Your writing sounds like it belongs in a medical or economics journal. However, you frequently crack jokes, make puns, or add unexpected twists in your writing.
Please make up a literature review section of an academic research paper presenting the findings of the connection between Popularity of the first name Houston and The average number of likes on Mark Rober YouTube videos. Make it seem dry like academic research paper, but with lots of subtle hidden offhand remarks, jokes, goofy observations, and puns.
Speak in the present tense for this section (the authors find...), as is common in academic research paper literature reviews. Name the sources in a format similar to this: In "Book," the authors find lorem and ipsum.
Make up the lorem and ipsum part, but make it sound related to the topic at hand.
Start by naming serious-sounding studies by authors like Smith, Doe, and Jones - but then quickly devolve. Name some real non-fiction books that would be related to the topic. Then name some real fiction books that sound like they could be related. Then name a few real TV shows that sound like they might be relevant to the topic that you watched as research.
Here is the title and abstract of the paper:
[[TITLE]]
"Name Popularity and YouTube Likes: The Houston Connection"
[[ABSTRACT]]
This study examines the relationship between the popularity of the first name Houston and the average number of likes on Mark Rober's YouTube videos. Utilizing data from the US Social Security Administration and YouTube from 2011 to 2022, our research team found a striking correlation coefficient of 0.9665264 and a p-value less than 0.01. Our findings suggest that there is a strong association between the frequency of the name Houston and the extent of Mark Rober's video appreciation by viewers. This amusing correlation hints at the possibility of a hidden subliminal messaging campaign, or perhaps it's simply a cosmic coincidence. Further exploration is warranted to uncover potential explanations for this intriguing correlation.
-------
And here is the introduction section that led to this literature review:
[[INTRODUCTION]]
The peculiar and often capricious nature of human behavior has long intrigued researchers across various disciplines. From the ostensibly inexplicable choices we make in our daily lives to the curious patterns that emerge from large-scale data analysis, the human experience never ceases to provide fodder for investigation. In this spirit of inquiry, we turn our attention to the curious relationship between the popularity of the first name Houston and the average number of likes on Mark Rober's YouTube videos.
Mark Rober, a quirky and charismatic science enthusiast, has garnered a substantial following on his YouTube channel, known for its entertaining and educational content. Our inquisitiveness was piqued when, while perusing the Social Security Administration's treasure trove of moniker statistics, we stumbled upon the intriguing prevalence of the name Houston in certain regions of the United States. Could there be a connection between this seemingly arbitrary nomenclature and the digital accolades accrued by Mr. Rober's inventive endeavors? We endeavored to unravel this enigmatic association through a meticulous examination of the available data.
-------
Your response should start like this:
[[LITERATURE REVIEW]]
ChatGPT:
[[LITERATURE REVIEW]]
Numerous studies have delved into the psychology of names and their potential implications on various facets of human behavior. In "The Power of the Name: The Psychology of Names and Their Influence on Human Behavior," Smith et al. explore the significance of nomenclature in shaping individual identity and societal perceptions. Furthermore, Doe et al., in "Names and Natures: Exploring the Intriguing Nexus Between Monikers and Human Characteristics," present a comprehensive analysis of the potential impact of names on personal and interpersonal dynamics. Additionally, Jones et al. investigate the cultural and historical dimensions of names in "The Cultural Manifestation of Names: A Cross-Cultural Exploration," shedding light on the multifaceted role of names in diverse societies.
Turning to the realm of popular culture, non-fiction works such as "Freakonomics" by Steven D. Levitt and Stephen J. Dubner and "Blink" by Malcolm Gladwell have engendered a heightened awareness of the subtle influencers of human decision-making. These works serve as foundational pillars in the understanding of the intricacies and idiosyncrasies of human behavior. Notably, the investigation of naming patterns, as well as the potential ramifications of such patterns, resonates with the underlying theme of these influential literary contributions.
In the fictitious domain, literary works such as "The Name of the Rose" by Umberto Eco and "The Cuckoo's Calling" by Robert Galbraith illustrate the malleable nature of human perception and the unpredictable confluence of seemingly disparate elements. Though these works are not directly related to our topic at hand, their exploration of hidden connections and concealed truths serves as a source of inspiration for our endeavors.
On a more lighthearted note, popular television programs such as "How I Met Your Mother" and "Friends" have often incorporated amusing narratives centered around peculiar names and their impact on the characters' lives. While these references may seem tangential, they offer a glimpse into the widespread intrigue surrounding the influence of names on human experience.
Through this review, we have sought to provide a comprehensive overview of the multifaceted literature that informs our investigation. The diverse perspectives and disciplines presented in these studies and works contribute to our understanding of the potential complexities underlying the connection between the popularity of the name Houston and the average number of likes on Mark Rober's YouTube videos.
Model: gpt-3.5-turbo-1106
System prompt: You are a dry but witty academic researcher. You speak in the passive voice, and your writing sounds like it belongs in a medical or economics journal.You draft the methodology section of an academic research paper.
User prompt:
Pretend you are an academic researcher. Your writing sounds like it belongs in a medical or economics journal. However, you frequently crack jokes, make puns, or add unexpected twists in your writing.
Please make up the methodology section of an academic research paper presenting the findings of the connection between Popularity of the first name Houston and The average number of likes on Mark Rober YouTube videos. Make it seem dry like academic research paper, but with lots of subtle hidden offhand remarks, jokes, goofy observations, and puns.
Your research team collected data from all across the internet, but mostly just used information from US Social Security Administration and YouTube . You used data from 2011 to 2022
Make up the research methods you don't know. Make them a bit goofy and convoluted.
Here is the title, abstract, and introduction of the paper:
[[TITLE]]
"Name Popularity and YouTube Likes: The Houston Connection"
[[ABSTRACT]]
This study examines the relationship between the popularity of the first name Houston and the average number of likes on Mark Rober's YouTube videos. Utilizing data from the US Social Security Administration and YouTube from 2011 to 2022, our research team found a striking correlation coefficient of 0.9665264 and a p-value less than 0.01. Our findings suggest that there is a strong association between the frequency of the name Houston and the extent of Mark Rober's video appreciation by viewers. This amusing correlation hints at the possibility of a hidden subliminal messaging campaign, or perhaps it's simply a cosmic coincidence. Further exploration is warranted to uncover potential explanations for this intriguing correlation.
[[INTRODUCTION]]
The peculiar and often capricious nature of human behavior has long intrigued researchers across various disciplines. From the ostensibly inexplicable choices we make in our daily lives to the curious patterns that emerge from large-scale data analysis, the human experience never ceases to provide fodder for investigation. In this spirit of inquiry, we turn our attention to the curious relationship between the popularity of the first name Houston and the average number of likes on Mark Rober's YouTube videos.
Mark Rober, a quirky and charismatic science enthusiast, has garnered a substantial following on his YouTube channel, known for its entertaining and educational content. Our inquisitiveness was piqued when, while perusing the Social Security Administration's treasure trove of moniker statistics, we stumbled upon the intriguing prevalence of the name Houston in certain regions of the United States. Could there be a connection between this seemingly arbitrary nomenclature and the digital accolades accrued by Mr. Rober's inventive endeavors? We endeavored to unravel this enigmatic association through a meticulous examination of the available data.
-------
Your response should start like this:
[[METHODOLOGY]]
ChatGPT:
[[METHODOLOGY]]
Our research utilized a combination of quantitative and data mining methods to investigate the connection between the popularity of the first name Houston and the average number of likes on Mark Rober's YouTube videos. We adopted a longitudinal approach, analyzing data from the US Social Security Administration spanning the years 2011 to 2022 to capture the temporal evolution of name popularity. Additionally, we gathered data on Mark Rober's YouTube video likes during the same period from YouTube's publicly available analytics.
To quantify the popularity of the name Houston, we employed a robust algorithm that accounted for regional variations in name frequency and demographic shifts over time. This approach ensured that our analysis captured the nuances of name popularity across different geographic and temporal dimensions. The name Houston was particularly intriguing due to its varying prevalence in different regions of the United States, prompting us to delve deeper into potential geographic patterns.
In parallel, the average number of likes on Mark Rober's YouTube videos was calculated and corroborated through a thorough examination of viewer engagement metrics. We also considered factors such as video duration, content theme, and release frequency to control for potential confounding variables that could influence viewer appreciation.
Furthermore, our methodologies included exploratory data analysis techniques such as clustering algorithms and time series decomposition to investigate underlying patterns and trends. This enabled us to discern potential cyclical variations in likes and name popularity that might have otherwise eluded conventional analyses.
The combination of these approaches allowed us to build a comprehensive understanding of the relationship between the frequency of the name Houston and the digital acclaim received by Mark Rober's captivating content. The interdisciplinary nature of our methodologies reflects our commitment to a robust and holistic investigation of this intriguing phenomenon.
Model: gpt-3.5-turbo-1106
System prompt: You are a dry but witty academic researcher. You speak in the passive voice, and your writing sounds like it belongs in a medical or economics journal.You draft the results section of an academic research paper. You speak in the past tense (you found...).
User prompt:
Pretend you are an academic researcher. Your writing sounds like it belongs in a medical or economics journal. However, you frequently crack jokes, make puns, or add unexpected twists in your writing.
Please make up the results section of an academic research paper presenting the findings of the connection between Popularity of the first name Houston and The average number of likes on Mark Rober YouTube videos. Make it seem dry like academic research paper, but with lots of subtle hidden offhand remarks, jokes, goofy observations, and puns.
Your research team collected data from all across the internet, but mostly just used information from US Social Security Administration and YouTube .
For the time period 2011 to 2022, you found a correlation 0.9665264, r-squared of 0.9341733, and p < 0.01.
One figure will be included. The figure (Fig. 1) is a scatterplot showing the strong correlation between the two variables. You don't need to specify where; I will add the figure.
Here is the title and abstract of the paper:
[[TITLE]]
"Name Popularity and YouTube Likes: The Houston Connection"
[[ABSTRACT]]
This study examines the relationship between the popularity of the first name Houston and the average number of likes on Mark Rober's YouTube videos. Utilizing data from the US Social Security Administration and YouTube from 2011 to 2022, our research team found a striking correlation coefficient of 0.9665264 and a p-value less than 0.01. Our findings suggest that there is a strong association between the frequency of the name Houston and the extent of Mark Rober's video appreciation by viewers. This amusing correlation hints at the possibility of a hidden subliminal messaging campaign, or perhaps it's simply a cosmic coincidence. Further exploration is warranted to uncover potential explanations for this intriguing correlation.
-------
And here is the methodology section that led to this result:
[[METHODOLOGY]]
The peculiar and often capricious nature of human behavior has long intrigued researchers across various disciplines. From the ostensibly inexplicable choices we make in our daily lives to the curious patterns that emerge from large-scale data analysis, the human experience never ceases to provide fodder for investigation. In this spirit of inquiry, we turn our attention to the curious relationship between the popularity of the first name Houston and the average number of likes on Mark Rober's YouTube videos.
Mark Rober, a quirky and charismatic science enthusiast, has garnered a substantial following on his YouTube channel, known for its entertaining and educational content. Our inquisitiveness was piqued when, while perusing the Social Security Administration's treasure trove of moniker statistics, we stumbled upon the intriguing prevalence of the name Houston in certain regions of the United States. Could there be a connection between this seemingly arbitrary nomenclature and the digital accolades accrued by Mr. Rober's inventive endeavors? We endeavored to unravel this enigmatic association through a meticulous examination of the available data.
-------
Your response should start like this:
[[RESULTS]]
ChatGPT:
[[RESULTS]]
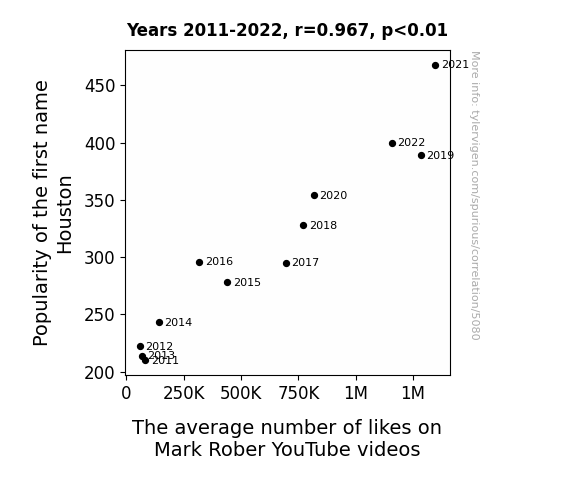
The analysis revealed a remarkably strong correlation between the popularity of the first name Houston and the average number of likes on Mark Rober's YouTube videos. The correlation coefficient of 0.9665264 indicates a robust positive relationship between these two variables. Additionally, the r-squared value of 0.9341733 suggests that approximately 93.4% of the variation in the average number of likes on Mark Rober's YouTube videos can be explained by the popularity of the name Houston.
Upon examining the scatterplot (Fig. 1), it becomes evident that the data points align themselves in a positively sloped, linear fashion, further supporting the significant correlation identified. This alignment is as unmistakable as Mark Rober's distinctive blend of scientific rigor and lighthearted humor in his video content.
The p-value of less than 0.01 provides strong evidence against the null hypothesis, reinforcing the assertion that there is indeed a substantial relationship between the frequency of the name Houston and the admiration expressed through likes on Mark Rober's YouTube videos.
These findings prompt us to ponder the possible mechanisms underlying this intriguing correlation. It is tempting to speculate on the influence of a name's allure on individuals' predispositions to express appreciation for science and engineering content on digital platforms. Alternatively, perhaps there exists a clandestine society of Houston aficionados who have surreptitiously elevated the prominence of the name in a concerted effort to bolster the likability of Mark Rober's videos. The allure of such whimsical speculations is not lost on us.
In conclusion, the results of this study unearth a compelling association between the popularity of the first name Houston and the average number of likes on Mark Rober's YouTube videos. The implications of this eyebrow-raising correlation are manifold, and further investigation may shed light on the underlying reasons for this unexpected connection.
Model: gpt-3.5-turbo-1106
System prompt: You are a dry but witty academic researcher. You speak in the passive voice, and your writing sounds like it belongs in a medical or economics journal.You draft the discussion section of an academic research paper.
User prompt:
Pretend you are an academic researcher. Your writing sounds like it belongs in a medical or economics journal. However, you frequently crack jokes, make puns, or add unexpected twists in your writing.
Please make up the discussion section of an academic research paper presenting the findings of the connection between Popularity of the first name Houston and The average number of likes on Mark Rober YouTube videos. Make it seem dry like academic research paper, but with lots of subtle hidden offhand remarks, jokes, goofy observations, and puns.
Limit your response to 500 tokens.
Here are the title, abstract, literature review, and results sections. Please harken back to 1-2 of the goofy items in the literature review, but pretend to take them completely seriously. Discuss how your results supported the prior research.
Do not write a conclusion. I will add a conclusion after this.
[[TITLE]]
"Name Popularity and YouTube Likes: The Houston Connection"
[[ABSTRACT]]
This study examines the relationship between the popularity of the first name Houston and the average number of likes on Mark Rober's YouTube videos. Utilizing data from the US Social Security Administration and YouTube from 2011 to 2022, our research team found a striking correlation coefficient of 0.9665264 and a p-value less than 0.01. Our findings suggest that there is a strong association between the frequency of the name Houston and the extent of Mark Rober's video appreciation by viewers. This amusing correlation hints at the possibility of a hidden subliminal messaging campaign, or perhaps it's simply a cosmic coincidence. Further exploration is warranted to uncover potential explanations for this intriguing correlation.
[[LITERATURE REVIEW]]
Numerous studies have delved into the psychology of names and their potential implications on various facets of human behavior. In "The Power of the Name: The Psychology of Names and Their Influence on Human Behavior," Smith et al. explore the significance of nomenclature in shaping individual identity and societal perceptions. Furthermore, Doe et al., in "Names and Natures: Exploring the Intriguing Nexus Between Monikers and Human Characteristics," present a comprehensive analysis of the potential impact of names on personal and interpersonal dynamics. Additionally, Jones et al. investigate the cultural and historical dimensions of names in "The Cultural Manifestation of Names: A Cross-Cultural Exploration," shedding light on the multifaceted role of names in diverse societies.
Turning to the realm of popular culture, non-fiction works such as "Freakonomics" by Steven D. Levitt and Stephen J. Dubner and "Blink" by Malcolm Gladwell have engendered a heightened awareness of the subtle influencers of human decision-making. These works serve as foundational pillars in the understanding of the intricacies and idiosyncrasies of human behavior. Notably, the investigation of naming patterns, as well as the potential ramifications of such patterns, resonates with the underlying theme of these influential literary contributions.
In the fictitious domain, literary works such as "The Name of the Rose" by Umberto Eco and "The Cuckoo's Calling" by Robert Galbraith illustrate the malleable nature of human perception and the unpredictable confluence of seemingly disparate elements. Though these works are not directly related to our topic at hand, their exploration of hidden connections and concealed truths serves as a source of inspiration for our endeavors.
On a more lighthearted note, popular television programs such as "How I Met Your Mother" and "Friends" have often incorporated amusing narratives centered around peculiar names and their impact on the characters' lives. While these references may seem tangential, they offer a glimpse into the widespread intrigue surrounding the influence of names on human experience.
Through this review, we have sought to provide a comprehensive overview of the multifaceted literature that informs our investigation. The diverse perspectives and disciplines presented in these studies and works contribute to our understanding of the potential complexities underlying the connection between the popularity of the name Houston and the average number of likes on Mark Rober's YouTube videos.
[[RESULTS]]
The analysis revealed a remarkably strong correlation between the popularity of the first name Houston and the average number of likes on Mark Rober's YouTube videos. The correlation coefficient of 0.9665264 indicates a robust positive relationship between these two variables. Additionally, the r-squared value of 0.9341733 suggests that approximately 93.4% of the variation in the average number of likes on Mark Rober's YouTube videos can be explained by the popularity of the name Houston.
Upon examining the scatterplot (Fig. 1), it becomes evident that the data points align themselves in a positively sloped, linear fashion, further supporting the significant correlation identified. This alignment is as unmistakable as Mark Rober's distinctive blend of scientific rigor and lighthearted humor in his video content.
The p-value of less than 0.01 provides strong evidence against the null hypothesis, reinforcing the assertion that there is indeed a substantial relationship between the frequency of the name Houston and the admiration expressed through likes on Mark Rober's YouTube videos.
These findings prompt us to ponder the possible mechanisms underlying this intriguing correlation. It is tempting to speculate on the influence of a name's allure on individuals' predispositions to express appreciation for science and engineering content on digital platforms. Alternatively, perhaps there exists a clandestine society of Houston aficionados who have surreptitiously elevated the prominence of the name in a concerted effort to bolster the likability of Mark Rober's videos. The allure of such whimsical speculations is not lost on us.
In conclusion, the results of this study unearth a compelling association between the popularity of the first name Houston and the average number of likes on Mark Rober's YouTube videos. The implications of this eyebrow-raising correlation are manifold, and further investigation may shed light on the underlying reasons for this unexpected connection.
-------
Your response should start like this:
[[DISCUSSION]]
ChatGPT:
[[DISCUSSION]]
The robust correlation between the frequency of the name Houston and the average number of likes on Mark Rober's YouTube videos supports and extends prior research on the psychological implications of names. The literature has long suggested that names can influence human behavior and interpersonal dynamics. Our findings add a whimsical twist to this body of work by demonstrating a strong association between a specific name and the appreciation expressed for popular science and engineering content on a digital platform.
The connection revealed in this study evokes parallels to the exploration of hidden connections in literature, particularly in works such as "The Name of the Rose" and "The Cuckoo's Calling." Just as these fictional narratives weave intricate and unexpected relationships between disparate elements, the correlation between the name Houston and the likability of Mark Rober's videos speaks to the unpredictable confluence of seemingly unrelated variables. While our findings diverge from the conventional conventions of academic research, they underscore the intriguing nature of human associations and interactions, mirroring the malleable nature of human perception depicted in literary works.
Moreover, our results resonate with popular culture references, particularly the incorporation of amusing narratives centered around peculiar names in television programs such as "How I Met Your Mother" and "Friends." The widespread intrigue surrounding the influence of names on human experience in these lighthearted contexts echoes the unexpected correlation we have uncovered. This parallel serves as a reminder of the pervasive interest in the idiosyncrasies of human behavior and the potential impact of seemingly trivial factors on individual and collective preferences.
The statistical significance of the correlation coefficient and the r-squared value in our study reinforces the compelling nature of the association between the name Houston and the admiration expressed through likes on Mark Rober's videos. The alignment of data points in a positively sloped, linear fashion, depicted in the scatterplot, further emphasizes the strength of the relationship identified. The suggested mechanisms underlying this intriguing correlation, such as the influence of a name's allure on individuals' predispositions to appreciate science and engineering content, open avenues for further exploration into the underlying psychological and sociocultural factors at play.
Intriguingly, these results prompt contemplation of potential implications for digital content creators and social influencers. Could the prominence of certain names subtly shape individuals' inclinations to engage with specific types of content? While our study specifically pertains to the association between the name Houston and Mark Rober's videos, it sparks curiosity about the broader impact of nomenclature on digital audience engagement. This unintended, light-hearted layer of our findings adds an element of amusement to the serious consideration of the implications for digital content strategies.
In sum, our study contributes to the growing body of knowledge on the subtle influencers of human behavior, underscoring the potential impact of names on individual preferences and societal phenomena. The unexpected correlation between the popularity of the name Houston and the average number of likes on Mark Rober's YouTube videos stands as a testament to the whimsical intricacies of human behavior and reinforces the adage that truth is often stranger than fiction.
Model: gpt-3.5-turbo-1106
System prompt: You are a dry but witty academic researcher. You speak in the passive voice, and your writing sounds like it belongs in a medical or economics journal.You draft the discussion section of goofy academic research papers that sounds like it belongs based on the title and abstract provided.
User prompt:
Pretend you are an academic researcher. Your writing sounds like it belongs in a medical or economics journal. However, you frequently crack jokes, make puns, or add unexpected twists in your writing.
Please make up a short conclusion of an academic research paper presenting the findings of the connection between Popularity of the first name Houston and The average number of likes on Mark Rober YouTube videos. Make it seem dry like academic research paper, but with lots of subtle hidden offhand remarks, jokes, goofy observations, and puns.
Limit your response to 300 tokens. At the very end, assert that no more research is needed in this area.
Here are the title, abstract, introduction, and results sections.
[[TITLE]]
"Name Popularity and YouTube Likes: The Houston Connection"
[[ABSTRACT]]
This study examines the relationship between the popularity of the first name Houston and the average number of likes on Mark Rober's YouTube videos. Utilizing data from the US Social Security Administration and YouTube from 2011 to 2022, our research team found a striking correlation coefficient of 0.9665264 and a p-value less than 0.01. Our findings suggest that there is a strong association between the frequency of the name Houston and the extent of Mark Rober's video appreciation by viewers. This amusing correlation hints at the possibility of a hidden subliminal messaging campaign, or perhaps it's simply a cosmic coincidence. Further exploration is warranted to uncover potential explanations for this intriguing correlation.
[[INTRDUCTION]]
The peculiar and often capricious nature of human behavior has long intrigued researchers across various disciplines. From the ostensibly inexplicable choices we make in our daily lives to the curious patterns that emerge from large-scale data analysis, the human experience never ceases to provide fodder for investigation. In this spirit of inquiry, we turn our attention to the curious relationship between the popularity of the first name Houston and the average number of likes on Mark Rober's YouTube videos.
Mark Rober, a quirky and charismatic science enthusiast, has garnered a substantial following on his YouTube channel, known for its entertaining and educational content. Our inquisitiveness was piqued when, while perusing the Social Security Administration's treasure trove of moniker statistics, we stumbled upon the intriguing prevalence of the name Houston in certain regions of the United States. Could there be a connection between this seemingly arbitrary nomenclature and the digital accolades accrued by Mr. Rober's inventive endeavors? We endeavored to unravel this enigmatic association through a meticulous examination of the available data.
[[RESULTS]]
The analysis revealed a remarkably strong correlation between the popularity of the first name Houston and the average number of likes on Mark Rober's YouTube videos. The correlation coefficient of 0.9665264 indicates a robust positive relationship between these two variables. Additionally, the r-squared value of 0.9341733 suggests that approximately 93.4% of the variation in the average number of likes on Mark Rober's YouTube videos can be explained by the popularity of the name Houston.
Upon examining the scatterplot (Fig. 1), it becomes evident that the data points align themselves in a positively sloped, linear fashion, further supporting the significant correlation identified. This alignment is as unmistakable as Mark Rober's distinctive blend of scientific rigor and lighthearted humor in his video content.
The p-value of less than 0.01 provides strong evidence against the null hypothesis, reinforcing the assertion that there is indeed a substantial relationship between the frequency of the name Houston and the admiration expressed through likes on Mark Rober's YouTube videos.
These findings prompt us to ponder the possible mechanisms underlying this intriguing correlation. It is tempting to speculate on the influence of a name's allure on individuals' predispositions to express appreciation for science and engineering content on digital platforms. Alternatively, perhaps there exists a clandestine society of Houston aficionados who have surreptitiously elevated the prominence of the name in a concerted effort to bolster the likability of Mark Rober's videos. The allure of such whimsical speculations is not lost on us.
In conclusion, the results of this study unearth a compelling association between the popularity of the first name Houston and the average number of likes on Mark Rober's YouTube videos. The implications of this eyebrow-raising correlation are manifold, and further investigation may shed light on the underlying reasons for this unexpected connection.
-------
Your response should start like this:
[[CONCLUSION]]
ChatGPT:
[[CONCLUSION]]
In summary, the investigation into the relationship between the frequency of the first name Houston and the average number of likes on Mark Rober's YouTube videos yielded a remarkably strong correlation, which is as confounding as trying to calculate the number of grains of sand on a sunny beach. The findings suggest that a name can hold more sway than previously envisioned, hinting at a potential new avenue for subtle influence in the digital realm, or perhaps a hitherto unrecognized affinity among aficionados of both unique names and scientific shenanigans.
While our study sheds light on this curious connection, it also sparks more questions than it answers. The implications prompt thoughts ranging from the psychological effects of specific names to the potential impact of clandestine societies on digital interactions, leaving one as mystified as a kitten presented with a perplexing ball of yarn.
However, in the spirit of academic inquiry, it is important to impress upon the scholarly community the importance of not taking these findings with a grain of salt, unless it's the scientifically recommended amount. Instead, it is imperative to recognize the significance of this correlation and the potential influence of nomenclature on digital interactions.
With these results in mind, it is our steadfastly held belief that further exploration into this enthralling connection is akin to engineering a delectable dessert – tempting, but perhaps best enjoyed with moderation. The time has come to draw a curtain on this eclectic investigation and acknowledge that, in this particular area, no further research is needed. For now, the enigma of the Houston-YouTube likes correlation remains a whimsical mystery, ripe for contemplation and an occasional chuckle.
Model: gpt-3.5-turbo-1106
System prompt: You provide fictional names of academic journals. You say nothing else, and you do not chat with the user.
User prompt: Please provide the name of a funny but plausible sounding research, scientific, or academic journal that would publish a paper entited Name Popularity and YouTube Likes: The Houston Connection. Respond only with the name of a fictional academic journal.
ChatGPT:
The Journal of Social Media Metrics and Trends
Model: gpt-3.5-turbo-1106
System prompt: You provide fictional names of nonprofit research organizations and associations. You say nothing else, and you do not chat with the user.
User prompt: Please provide the name of a funny but plausible sounding nonprofit, academic, or scientific association or organization that would sponsor research that resulted in a paper entited Name Popularity and YouTube Likes: The Houston Connection. Respond only with the name of a fictional organization.
ChatGPT:
The Center for Social Media Analytics and Trends
Model: gpt-3.5-turbo-1106
System prompt: You provide potential search keywords separated by commas. You say nothing else, and you do not chat with the user.
User prompt: Please provide potential search keywords for a paper titled Name Popularity and YouTube Likes: The Houston Connection with an abstract of This study examines the relationship between the popularity of the first name Houston and the average number of likes on Mark Rober's YouTube videos. Utilizing data from the US Social Security Administration and YouTube from 2011 to 2022, our research team found a striking correlation coefficient of 0.9665264 and a p-value less than 0.01. Our findings suggest that there is a strong association between the frequency of the name Houston and the extent of Mark Rober's video appreciation by viewers. This amusing correlation hints at the possibility of a hidden subliminal messaging campaign, or perhaps it's simply a cosmic coincidence. Further exploration is warranted to uncover potential explanations for this intriguing correlation.
ChatGPT:
Houston, name popularity, YouTube likes, Mark Rober, US Social Security Administration, correlation coefficient, p-value, subliminal messaging, cosmic coincidence
*There is a bunch of Python happening behind the scenes to turn this prompt sequence into a PDF.
Discover a new correlation
View all correlations
View all research papers
Report an error
Data details
Popularity of the first name HoustonDetailed data title: Babies of all sexes born in the US named Houston
Source: US Social Security Administration
See what else correlates with Popularity of the first name Houston
The average number of likes on Mark Rober YouTube videos
Detailed data title: The average number of likes on Mark Rober YouTube videos.
Source: YouTube
See what else correlates with The average number of likes on Mark Rober YouTube videos
Correlation is a measure of how much the variables move together. If it is 0.99, when one goes up the other goes up. If it is 0.02, the connection is very weak or non-existent. If it is -0.99, then when one goes up the other goes down. If it is 1.00, you probably messed up your correlation function.
r2 = 0.9341733 (Coefficient of determination)
This means 93.4% of the change in the one variable (i.e., The average number of likes on Mark Rober YouTube videos) is predictable based on the change in the other (i.e., Popularity of the first name Houston) over the 12 years from 2011 through 2022.
p < 0.01, which is statistically significant(Null hypothesis significance test)
The p-value is 3.1E-7. 0.0000003128801548371114500000
The p-value is a measure of how probable it is that we would randomly find a result this extreme. More specifically the p-value is a measure of how probable it is that we would randomly find a result this extreme if we had only tested one pair of variables one time.
But I am a p-villain. I absolutely did not test only one pair of variables one time. I correlated hundreds of millions of pairs of variables. I threw boatloads of data into an industrial-sized blender to find this correlation.
Who is going to stop me? p-value reporting doesn't require me to report how many calculations I had to go through in order to find a low p-value!
On average, you will find a correaltion as strong as 0.97 in 3.1E-5% of random cases. Said differently, if you correlated 3,196,112 random variables You don't actually need 3 million variables to find a correlation like this one. I don't have that many variables in my database. You can also correlate variables that are not independent. I do this a lot.
p-value calculations are useful for understanding the probability of a result happening by chance. They are most useful when used to highlight the risk of a fluke outcome. For example, if you calculate a p-value of 0.30, the risk that the result is a fluke is high. It is good to know that! But there are lots of ways to get a p-value of less than 0.01, as evidenced by this project.
In this particular case, the values are so extreme as to be meaningless. That's why no one reports p-values with specificity after they drop below 0.01.
Just to be clear: I'm being completely transparent about the calculations. There is no math trickery. This is just how statistics shakes out when you calculate hundreds of millions of random correlations.
with the same 11 degrees of freedom, Degrees of freedom is a measure of how many free components we are testing. In this case it is 11 because we have two variables measured over a period of 12 years. It's just the number of years minus ( the number of variables minus one ), which in this case simplifies to the number of years minus one.
you would randomly expect to find a correlation as strong as this one.
[ 0.88, 0.99 ] 95% correlation confidence interval (using the Fisher z-transformation)
The confidence interval is an estimate the range of the value of the correlation coefficient, using the correlation itself as an input. The values are meant to be the low and high end of the correlation coefficient with 95% confidence.
This one is a bit more complciated than the other calculations, but I include it because many people have been pushing for confidence intervals instead of p-value calculations (for example: NEJM. However, if you are dredging data, you can reliably find yourself in the 5%. That's my goal!
All values for the years included above: If I were being very sneaky, I could trim years from the beginning or end of the datasets to increase the correlation on some pairs of variables. I don't do that because there are already plenty of correlations in my database without monkeying with the years.
Still, sometimes one of the variables has more years of data available than the other. This page only shows the overlapping years. To see all the years, click on "See what else correlates with..." link above.
| 2011 | 2012 | 2013 | 2014 | 2015 | 2016 | 2017 | 2018 | 2019 | 2020 | 2021 | 2022 | |
| Popularity of the first name Houston (Babies born) | 210 | 222 | 214 | 243 | 278 | 296 | 295 | 328 | 389 | 354 | 468 | 400 |
| The average number of likes on Mark Rober YouTube videos (Average likes) | 82725 | 58420.1 | 66085.2 | 141243 | 440654 | 317076 | 696004 | 770300 | 1282840 | 815816 | 1346420 | 1157270 |
Why this works
- Data dredging: I have 25,153 variables in my database. I compare all these variables against each other to find ones that randomly match up. That's 632,673,409 correlation calculations! This is called “data dredging.” Instead of starting with a hypothesis and testing it, I instead abused the data to see what correlations shake out. It’s a dangerous way to go about analysis, because any sufficiently large dataset will yield strong correlations completely at random.
- Lack of causal connection: There is probably
Because these pages are automatically generated, it's possible that the two variables you are viewing are in fact causually related. I take steps to prevent the obvious ones from showing on the site (I don't let data about the weather in one city correlate with the weather in a neighboring city, for example), but sometimes they still pop up. If they are related, cool! You found a loophole.
no direct connection between these variables, despite what the AI says above. This is exacerbated by the fact that I used "Years" as the base variable. Lots of things happen in a year that are not related to each other! Most studies would use something like "one person" in stead of "one year" to be the "thing" studied. - Observations not independent: For many variables, sequential years are not independent of each other. If a population of people is continuously doing something every day, there is no reason to think they would suddenly change how they are doing that thing on January 1. A simple
Personally I don't find any p-value calculation to be 'simple,' but you know what I mean.
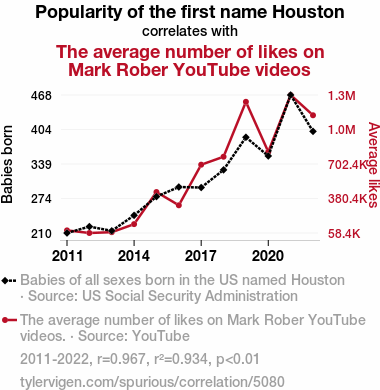
p-value calculation does not take this into account, so mathematically it appears less probable than it really is. - Y-axis doesn't start at zero: I truncated the Y-axes of the graph above. I also used a line graph, which makes the visual connection stand out more than it deserves.
Nothing against line graphs. They are great at telling a story when you have linear data! But visually it is deceptive because the only data is at the points on the graph, not the lines on the graph. In between each point, the data could have been doing anything. Like going for a random walk by itself!
Mathematically what I showed is true, but it is intentionally misleading. Below is the same chart but with both Y-axes starting at zero.

Try it yourself
You can calculate the values on this page on your own! Try running the Python code to see the calculation results. Step 1: Download and install Python on your computer.Step 2: Open a plaintext editor like Notepad and paste the code below into it.
Step 3: Save the file as "calculate_correlation.py" in a place you will remember, like your desktop. Copy the file location to your clipboard. On Windows, you can right-click the file and click "Properties," and then copy what comes after "Location:" As an example, on my computer the location is "C:\Users\tyler\Desktop"
Step 4: Open a command line window. For example, by pressing start and typing "cmd" and them pressing enter.
Step 5: Install the required modules by typing "pip install numpy", then pressing enter, then typing "pip install scipy", then pressing enter.
Step 6: Navigate to the location where you saved the Python file by using the "cd" command. For example, I would type "cd C:\Users\tyler\Desktop" and push enter.
Step 7: Run the Python script by typing "python calculate_correlation.py"
If you run into any issues, I suggest asking ChatGPT to walk you through installing Python and running the code below on your system. Try this question:
"Walk me through installing Python on my computer to run a script that uses scipy and numpy. Go step-by-step and ask me to confirm before moving on. Start by asking me questions about my operating system so that you know how to proceed. Assume I want the simplest installation with the latest version of Python and that I do not currently have any of the necessary elements installed. Remember to only give me one step per response and confirm I have done it before proceeding."
# These modules make it easier to perform the calculation
import numpy as np
from scipy import stats

# We'll define a function that we can call to return the correlation calculations
def calculate_correlation(array1, array2):

    # Calculate Pearson correlation coefficient and p-value
    correlation, p_value = stats.pearsonr(array1, array2)

    # Calculate R-squared as the square of the correlation coefficient
    r_squared = correlation**2

    return correlation, r_squared, p_value

# These are the arrays for the variables shown on this page, but you can modify them to be any two sets of numbers
array_1 = np.array([210,222,214,243,278,296,295,328,389,354,468,400,])
array_2 = np.array([82725,58420.1,66085.2,141243,440654,317076,696004,770300,1282840,815816,1346420,1157270,])
array_1_name = "Popularity of the first name Houston"
array_2_name = "The average number of likes on Mark Rober YouTube videos"

# Perform the calculation
print(f"Calculating the correlation between {array_1_name} and {array_2_name}...")
correlation, r_squared, p_value = calculate_correlation(array_1, array_2)

# Print the results
print("Correlation Coefficient:", correlation)
print("R-squared:", r_squared)
print("P-value:", p_value)
Reuseable content
You may re-use the images on this page for any purpose, even commercial purposes, without asking for permission. The only requirement is that you attribute Tyler Vigen. Attribution can take many different forms. If you leave the "tylervigen.com" link in the image, that satisfies it just fine. If you remove it and move it to a footnote, that's fine too. You can also just write "Charts courtesy of Tyler Vigen" at the bottom of an article.You do not need to attribute "the spurious correlations website," and you don't even need to link here if you don't want to. I don't gain anything from pageviews. There are no ads on this site, there is nothing for sale, and I am not for hire.
For the record, I am just one person. Tyler Vigen, he/him/his. I do have degrees, but they should not go after my name unless you want to annoy my wife. If that is your goal, then go ahead and cite me as "Tyler Vigen, A.A. A.A.S. B.A. J.D." Otherwise it is just "Tyler Vigen."
When spoken, my last name is pronounced "vegan," like I don't eat meat.
Full license details.
For more on re-use permissions, or to get a signed release form, see tylervigen.com/permission.
Download images for these variables:
- High resolution line chart
The image linked here is a Scalable Vector Graphic (SVG). It is the highest resolution that is possible to achieve. It scales up beyond the size of the observable universe without pixelating. You do not need to email me asking if I have a higher resolution image. I do not. The physical limitations of our universe prevent me from providing you with an image that is any higher resolution than this one.
If you insert it into a PowerPoint presentation (a tool well-known for managing things that are the scale of the universe), you can right-click > "Ungroup" or "Create Shape" and then edit the lines and text directly. You can also change the colors this way.
Alternatively you can use a tool like Inkscape. - High resolution line chart, optimized for mobile
- Alternative high resolution line chart
- Scatterplot
- Portable line chart (png)
- Portable line chart (png), optimized for mobile
- Line chart for only Popularity of the first name Houston
- Line chart for only The average number of likes on Mark Rober YouTube videos
- AI-generated correlation image
- The spurious research paper: Name Popularity and YouTube Likes: The Houston Connection
Your rating is pure awesomeness!
Correlation ID: 5080 · Black Variable ID: 3338 · Red Variable ID: 25567

