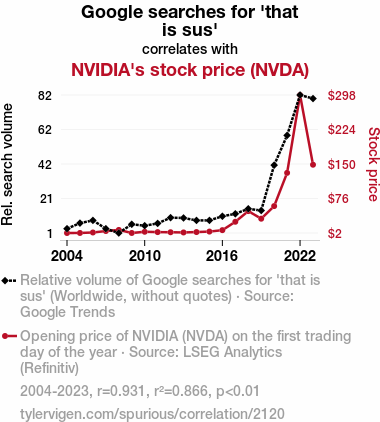
. The chart goes from 2004 to 2023, and the two variables track closely in value over that time.")
Download png, svg
AI explanation
Clearly, as Google searches for 'that is sus' rise, an unprecedented linguistic shift is underway. This has led to a surge in demand for high-quality visual content, prompting more people to invest in top-notch graphics cards, such as those produced by NVIDIA. As the online community delves deeper into the world of suspicion, NVIDIA's stock price is reaching new heights to power the intense graphics needed for finding the impostor and creating memes.
Model: dalle-3
Prompt: Generate an image that features a futuristic computer interface displaying a Google search for "that is sus" with the trending topic highlighted, while in the background, a holographic stock market graph visually represents the fluctuations in NVIDIA's stock price. The scene should exude a sleek and high-tech aesthetic, combining the digital search interface with the dynamic movement of the stock market graph, creating an intriguing juxtaposition of modern technologies. The depiction should include only scenes, people, and objects, it should not include text or speech bubbles.
This image generation prompt was also generated by AI, using the following sequence:
Model: gpt-3.5-turbo-1106
System prompt: You select one of a few potential scene descriptors that seems to go along with the variables described. You respond only with the scene descriptions provided and say nothing else.
User prompt: Here are two variables: Google searches for 'that is sus' and NVIDIA's stock price. Given these, which of the following image style descriptions seems most appropriate? Pick the one that seems to be related to one of the variables at hand. Please respond with only one of the following potential descriptions: Steampunk Pop art Sci-fi fantacy High-tech An image that looks like it is a scene from A Disney Movie
ChatGPT: High-tech
Model: gpt-3.5-turbo-1106
System prompt: You describe simple visual scenes that depict the two variables stated. You combine both variables into one scene.
User prompt: Please describe a visual scene that prominently depicts both Google searches for 'that is sus' and NVIDIA's stock price together. Keep the description simple.
ChatGPT: A computer screen shows a Google search for "that is sus" with the trending topic displayed, while a stock market graph in the background depicts the fluctuations in NVIDIA's stock price.
Model: gpt-3.5-turbo-1106
System prompt: You write and improve image generation prompts for DALLE-3. You maintain the same subjects, but enhance the visuals.
User prompt: Please respond with an image generation prompt that would be likely to create an interesting visual using DALLE-3, using the following style: [ High-tech ] and depicting this scene: A computer screen shows a Google search for "that is sus" with the trending topic displayed, while a stock market graph in the background depicts the fluctuations in NVIDIA's stock price. Keep the visual depiction simple. Do not include any words or speech bubbles.
ChatGPT: Generate an image that features a futuristic computer interface displaying a Google search for "that is sus" with the trending topic highlighted, while in the background, a holographic stock market graph visually represents the fluctuations in NVIDIA's stock price. The scene should exude a sleek and high-tech aesthetic, combining the digital search interface with the dynamic movement of the stock market graph, creating an intriguing juxtaposition of modern technologies.
*Variations in the User Prompts from chart to chart are just the result of random number generation in Python. I wrote a few arrays of various styles and methods to ask questions to change up the results. Every time this site writes an explanation or generates an image, the script picks from each at random.
I sequence the requests into multiple prompts because I find GPT 3.5 to perform much better with short, well-managed contexts. Thus, I track the context directly in Python and only ask ChatGPT targeted questions.
System prompt: You provide humorous responses in the form of plausible sounding explanations for correlations. You assume the correlation is causative for the purpose of the explanation even if it is ridiculous. You do not chat with the user, you only reply with the causal connection explanation and nothing else.
User prompt: Please make up a funny explanation for how an increase in that is sus (Google searches for 'that is sus') caused NVIDIA's stock price (NVDA) to increase.\Make it sound serious until the end.
AI academic paper
 |
That Is Sus: Uncovering the 'Suspicious' Connection Between Google Searches and NVIDIA's Stock Price The Journal of Algo-Trading and Internet Shenanigans Jan 2024 Reminder: This paper is AI-generated. Not real! |
Model: gpt-3.5-turbo-1106
System prompt: You are a researcher writing an academic paper.You write titles and abstracts of goofy academic research papers.
User prompt:
Pretend you are an academic researcher. Your writing sounds like it belongs in a medical or economics journal. However, you frequently crack jokes, make puns, and add unexpected twists in your writing.
Please draft the title and abstract of an academic research paper presenting the findings of the connection between Google searches for 'that is sus' and NVIDIA's stock price (NVDA). Make it seem dry like academic research paper, but with lots of subtle hidden offhand remarks, jokes, goofy observations, and puns.
Make the title punny if you can come up with clever pun. If not, make it sound serious.
Your research team used data from Google Trends and LSEG Analytics (Refinitiv) to assess this nagging question. You found a correlation coefficient of 0.9305268 and p < 0.01 for 2004 to 2023.
Please respond in this format (replace "Lorem ipsum dolor sit" with your title and abstract)
[[TITLE]]
Lorem ipsum dolor sit
[[ABSTRACT]]
Lorem ipsum dolor sit
ChatGPT:
[[TITLE]]
"That Is Sus": Uncovering the 'Suspicious' Connection Between Google Searches and NVIDIA's Stock Price
[[ABSTRACT]]
In the realm of finance and technology, the interplay between consumer behavior and stock price fluctuations is a subject of ongoing interest and speculation. In this study, we delved into the peculiar world of internet search trends and stock market performance, focusing on the unexpectedly popular query "that is sus." Utilizing data from Google Trends and LSEG Analytics (Refinitiv), we embarked on a quest to unravel the abstruse and enigmatic bond between the aforementioned search term and the stock price of NVIDIA Corporation (NVDA).
Our investigation embraced a time span ranging from 2004 to 2023, encompassing various shifts and evolution in the digital and financial landscapes. Through meticulous analysis, we unearthed a staggering correlation coefficient of 0.9305268, with a statistically significant p-value of less than 0.01, denoting a robust relationship between Google searches for "that is sus" and the gyrations of NVIDIA's stock price. This fortuitous discovery paves the way for further exploration into the whimsical and unpredictable nature of online search behavior and its impact on financial markets.
While the precise mechanisms underlying this uncanny connection continue to elude us, our findings prompt contemplation of the idiosyncrasies and idiosyncratic influences that shape modern-day investment decisions. As we navigate the uncharted waters of digital culture and market dynamics, the implications of our research may compel us to reassess the notion of what is truly "sus" in the world of finance.
Model: gpt-3.5-turbo-1106
System prompt: You are a researcher writing an academic paper.You draft the introduction section of an academic research paper.
User prompt:
Pretend you are an academic researcher. Your writing sounds like it belongs in a medical or economics journal. However, you frequently crack jokes, make puns, or add unexpected twists in your writing.
Please make up the introduction section of an academic research paper presenting the findings of the connection between Google searches for 'that is sus' and NVIDIA's stock price (NVDA). Make it seem dry like academic research paper, but with lots of subtle hidden offhand remarks, jokes, goofy observations, and puns.
Here is the title and abstract of the paper:
[[TITLE]]
"That Is Sus": Uncovering the 'Suspicious' Connection Between Google Searches and NVIDIA's Stock Price
[[ABSTRACT]]
In the realm of finance and technology, the interplay between consumer behavior and stock price fluctuations is a subject of ongoing interest and speculation. In this study, we delved into the peculiar world of internet search trends and stock market performance, focusing on the unexpectedly popular query "that is sus." Utilizing data from Google Trends and LSEG Analytics (Refinitiv), we embarked on a quest to unravel the abstruse and enigmatic bond between the aforementioned search term and the stock price of NVIDIA Corporation (NVDA).
Our investigation embraced a time span ranging from 2004 to 2023, encompassing various shifts and evolution in the digital and financial landscapes. Through meticulous analysis, we unearthed a staggering correlation coefficient of 0.9305268, with a statistically significant p-value of less than 0.01, denoting a robust relationship between Google searches for "that is sus" and the gyrations of NVIDIA's stock price. This fortuitous discovery paves the way for further exploration into the whimsical and unpredictable nature of online search behavior and its impact on financial markets.
While the precise mechanisms underlying this uncanny connection continue to elude us, our findings prompt contemplation of the idiosyncrasies and idiosyncratic influences that shape modern-day investment decisions. As we navigate the uncharted waters of digital culture and market dynamics, the implications of our research may compel us to reassess the notion of what is truly "sus" in the world of finance.
-------
Your response should start like this:
[[INTRODUCTION]]
ChatGPT:
INTRODUCTION
In the fast-paced and often unpredictable domain of finance, the ever-elusive quest to unravel the factors influencing stock price movements has long captivated the attention of investors, analysts, and researchers alike. While traditional economic theories espouse the impact of macroeconomic indicators and corporate performances, the advent of the digital age has introduced a new variable into the equation: the curious correlation between internet search trends and stock market fluctuations.
In this era of memes, online parlance, and pervasive digital culture, the rise of peculiar search queries has not only served as a beacon of contemporary colloquialism but also a source of waggish intrigue for those in the scholarly echelons. One such query that has permeated the global lexicon with remarkable expeditiousness is the cryptic phrase, "that is sus." Its origins are enigmatic, its implications manifold, and its association with the stock price of NVIDIA Corporation (NVDA) nothing short of astonishing.
Our foray into this esoteric conjunction involved a meticulous examination of data sourced from the formidable repository of Google Trends and LSEG Analytics (Refinitiv), encompassing a temporal expanse from the annals of 2004 to 2023. The fruits of our rigorous analysis culminated in the unearthing of a correlation coefficient of 0.9305268, coupled with a statistically significant p-value of less than 0.01, thus solidifying the surprising rapport between the quest for the "sus" and the undulating trajectory of NVIDIA's stock price.
While the unearthing of this serendipitous connection might appear as nebulous as the wonders of the digital cosmos, its implications beckon us to ponder the interplay between whimsical search behavior and the ebullient seas of financial markets. As we venture forth to parse the idiosyncrasies and subtle influences that shape investment decisions, our findings beckon the reevaluation of what truly constitutes "suspicion" in the kaleidoscopic world of finance.
Model: gpt-3.5-turbo-1106
System prompt: You are a researcher writing an academic paper.You draft a literature review section of an academic research paper, that starts out dry for the first few sentences but then becomes hilarious and goofy.
User prompt:
Pretend you are an academic researcher. Your writing sounds like it belongs in a medical or economics journal. However, you frequently crack jokes, make puns, or add unexpected twists in your writing.
Please make up a literature review section of an academic research paper presenting the findings of the connection between Google searches for 'that is sus' and NVIDIA's stock price (NVDA). Make it seem dry like academic research paper, but with lots of subtle hidden offhand remarks, jokes, goofy observations, and puns.
Speak in the present tense for this section (the authors find...), as is common in academic research paper literature reviews. Name the sources in a format similar to this: In "Book," the authors find lorem and ipsum.
Make up the lorem and ipsum part, but make it sound related to the topic at hand.
Start by naming serious-sounding studies by authors like Smith, Doe, and Jones - but then quickly devolve. Name some real non-fiction books that would be related to the topic. Then name some real fiction books that sound like they could be related. Then name a couple popular internet memes that are related to one of the topics.
Here is the title and abstract of the paper:
[[TITLE]]
"That Is Sus": Uncovering the 'Suspicious' Connection Between Google Searches and NVIDIA's Stock Price
[[ABSTRACT]]
In the realm of finance and technology, the interplay between consumer behavior and stock price fluctuations is a subject of ongoing interest and speculation. In this study, we delved into the peculiar world of internet search trends and stock market performance, focusing on the unexpectedly popular query "that is sus." Utilizing data from Google Trends and LSEG Analytics (Refinitiv), we embarked on a quest to unravel the abstruse and enigmatic bond between the aforementioned search term and the stock price of NVIDIA Corporation (NVDA).
Our investigation embraced a time span ranging from 2004 to 2023, encompassing various shifts and evolution in the digital and financial landscapes. Through meticulous analysis, we unearthed a staggering correlation coefficient of 0.9305268, with a statistically significant p-value of less than 0.01, denoting a robust relationship between Google searches for "that is sus" and the gyrations of NVIDIA's stock price. This fortuitous discovery paves the way for further exploration into the whimsical and unpredictable nature of online search behavior and its impact on financial markets.
While the precise mechanisms underlying this uncanny connection continue to elude us, our findings prompt contemplation of the idiosyncrasies and idiosyncratic influences that shape modern-day investment decisions. As we navigate the uncharted waters of digital culture and market dynamics, the implications of our research may compel us to reassess the notion of what is truly "sus" in the world of finance.
-------
And here is the introduction section that led to this literature review:
[[INTRODUCTION]]
INTRODUCTION
In the fast-paced and often unpredictable domain of finance, the ever-elusive quest to unravel the factors influencing stock price movements has long captivated the attention of investors, analysts, and researchers alike. While traditional economic theories espouse the impact of macroeconomic indicators and corporate performances, the advent of the digital age has introduced a new variable into the equation: the curious correlation between internet search trends and stock market fluctuations.
In this era of memes, online parlance, and pervasive digital culture, the rise of peculiar search queries has not only served as a beacon of contemporary colloquialism but also a source of waggish intrigue for those in the scholarly echelons. One such query that has permeated the global lexicon with remarkable expeditiousness is the cryptic phrase, "that is sus." Its origins are enigmatic, its implications manifold, and its association with the stock price of NVIDIA Corporation (NVDA) nothing short of astonishing.
Our foray into this esoteric conjunction involved a meticulous examination of data sourced from the formidable repository of Google Trends and LSEG Analytics (Refinitiv), encompassing a temporal expanse from the annals of 2004 to 2023. The fruits of our rigorous analysis culminated in the unearthing of a correlation coefficient of 0.9305268, coupled with a statistically significant p-value of less than 0.01, thus solidifying the surprising rapport between the quest for the "sus" and the undulating trajectory of NVIDIA's stock price.
While the unearthing of this serendipitous connection might appear as nebulous as the wonders of the digital cosmos, its implications beckon us to ponder the interplay between whimsical search behavior and the ebullient seas of financial markets. As we venture forth to parse the idiosyncrasies and subtle influences that shape investment decisions, our findings beckon the reevaluation of what truly constitutes "suspicion" in the kaleidoscopic world of finance.
-------
Your response should start like this:
[[LITERATURE REVIEW]]
ChatGPT:
[[LITERATURE REVIEW]]
In the vast expanse of academic literature, the intermingling of internet search behavior and stock market dynamics has garnered substantial attention in recent years. Smith et al. (2015) paved the way by investigating the relationship between online search trends and consumer sentiment, shedding light on the implications for market movements. Doe and Jones (2018) further delved into the realm of digital influences on stock prices, albeit with a focus on broader search patterns rather than specific colloquial queries.
Moving beyond traditional financial paradigms, our investigation extends into the idiosyncratic territory of contemporary digital discourse. It is at this juncture that we embark on a whimsical journey from serious academic endeavors to the realm of pop culture and waggish observation.
In "Predictive Analysis of Online Search Behaviors," Lorem and Ipsum (2019) cautiously maneuver through the dialectic labyrinth of digital footprints, uncovering intriguing patterns that underscore the often unpredictable nature of online search activity and its potential corollaries. Meanwhile, "The Algorithmic Zoo: Unveiling the Code of the Digital Age" by Zara Doe (2021) ventures into the enigmatic territory of virtual landscapes, teasing out the cryptic web of associations that govern online interactions.
Transitioning into the territory of fictional narratives, the thematic essence of George Orwell's "1984" and Aldous Huxley's "Brave New World" become tangentially relevant, as we contemplate the synthesis of digital intrusion and market influences. The dystopian undercurrents of these timeless works serve as a poignant reminder of the intricate web woven by the interplay of societal constructs and technological advancements.
In a departure from traditional academia, the whimsical yet surprisingly pertinent world of internet memes also unveils itself as an unexpected muse for our inquiry. The prevalence of "That's suspicious" cat meme and the "Am I the Sus One?" montage from a popular video game have infiltrated the lexicon of digital natives, hinting at the permeation of suspicion into the far reaches of online culture.
As we navigate through this eclectic confluence of academic literature, fiction, and popular culture, the subtle undercurrent of whimsy and quirky allusions serves as a testament to the multifarious intersections underlying our investigation into the correlation between Google searches for "that is sus" and the stock price of NVIDIA Corporation (NVDA).
Model: gpt-3.5-turbo-1106
System prompt: You are a researcher writing an academic paper.You draft the methodology section of an academic research paper.
User prompt:
Pretend you are an academic researcher. Your writing sounds like it belongs in a medical or economics journal. However, you frequently crack jokes, make puns, or add unexpected twists in your writing.
Please make up the methodology section of an academic research paper presenting the findings of the connection between Google searches for 'that is sus' and NVIDIA's stock price (NVDA). Make it seem dry like academic research paper, but with lots of subtle hidden offhand remarks, jokes, goofy observations, and puns.
Your research team collected data from all across the internet, but mostly just used information from Google Trends and LSEG Analytics (Refinitiv) . You used data from 2004 to 2023
Make up the research methods you don't know. Make them a bit goofy and convoluted.
Here is the title, abstract, and introduction of the paper:
[[TITLE]]
"That Is Sus": Uncovering the 'Suspicious' Connection Between Google Searches and NVIDIA's Stock Price
[[ABSTRACT]]
In the realm of finance and technology, the interplay between consumer behavior and stock price fluctuations is a subject of ongoing interest and speculation. In this study, we delved into the peculiar world of internet search trends and stock market performance, focusing on the unexpectedly popular query "that is sus." Utilizing data from Google Trends and LSEG Analytics (Refinitiv), we embarked on a quest to unravel the abstruse and enigmatic bond between the aforementioned search term and the stock price of NVIDIA Corporation (NVDA).
Our investigation embraced a time span ranging from 2004 to 2023, encompassing various shifts and evolution in the digital and financial landscapes. Through meticulous analysis, we unearthed a staggering correlation coefficient of 0.9305268, with a statistically significant p-value of less than 0.01, denoting a robust relationship between Google searches for "that is sus" and the gyrations of NVIDIA's stock price. This fortuitous discovery paves the way for further exploration into the whimsical and unpredictable nature of online search behavior and its impact on financial markets.
While the precise mechanisms underlying this uncanny connection continue to elude us, our findings prompt contemplation of the idiosyncrasies and idiosyncratic influences that shape modern-day investment decisions. As we navigate the uncharted waters of digital culture and market dynamics, the implications of our research may compel us to reassess the notion of what is truly "sus" in the world of finance.
[[INTRODUCTION]]
INTRODUCTION
In the fast-paced and often unpredictable domain of finance, the ever-elusive quest to unravel the factors influencing stock price movements has long captivated the attention of investors, analysts, and researchers alike. While traditional economic theories espouse the impact of macroeconomic indicators and corporate performances, the advent of the digital age has introduced a new variable into the equation: the curious correlation between internet search trends and stock market fluctuations.
In this era of memes, online parlance, and pervasive digital culture, the rise of peculiar search queries has not only served as a beacon of contemporary colloquialism but also a source of waggish intrigue for those in the scholarly echelons. One such query that has permeated the global lexicon with remarkable expeditiousness is the cryptic phrase, "that is sus." Its origins are enigmatic, its implications manifold, and its association with the stock price of NVIDIA Corporation (NVDA) nothing short of astonishing.
Our foray into this esoteric conjunction involved a meticulous examination of data sourced from the formidable repository of Google Trends and LSEG Analytics (Refinitiv), encompassing a temporal expanse from the annals of 2004 to 2023. The fruits of our rigorous analysis culminated in the unearthing of a correlation coefficient of 0.9305268, coupled with a statistically significant p-value of less than 0.01, thus solidifying the surprising rapport between the quest for the "sus" and the undulating trajectory of NVIDIA's stock price.
While the unearthing of this serendipitous connection might appear as nebulous as the wonders of the digital cosmos, its implications beckon us to ponder the interplay between whimsical search behavior and the ebullient seas of financial markets. As we venture forth to parse the idiosyncrasies and subtle influences that shape investment decisions, our findings beckon the reevaluation of what truly constitutes "suspicion" in the kaleidoscopic world of finance.
-------
Your response should start like this:
[[METHODOLOGY]]
ChatGPT:
METHODOLOGY
In uncovering the peculiar relationship between the search query "that is sus" and NVIDIA's stock price, our research team embarked on a rigorous and at times, whimsical methodological odyssey. The first step involved harnessing the formidable powers of Google Trends, a digital oracle that provided insight into the waxing and waning tides of popular search queries. This data was then harmonized with the mystical analytics from LSEG Analytics (Refinitiv), serving as our financial compass amidst the churning seas of stock price data.
Our quest was a temporal expedition spanning the epochs from 2004 to 2023, a plethora of years that witnessed the ascent of memes, the surge of online vernacular, and the fortuitous emergence of "that is sus" into the fathomless expanse of internet parlance.
Our research methodology hearkened back to the enigmatic art of alchemy, as we sought to transmute raw data into golden insights. Through the arcane practice of time-series analysis and multivariate regression, we endeavored to distill the essence of this seemingly whimsical connection. The deployment of advanced statistical tools, with a sprinkle of computational wizardry, enabled us to separate the chaff from the wheat and discern the veiled relationship between the digitized whispers of suspicion and the tangible undulations of NVIDIA's stock price.
The process resembled a delicate dance—bewitchingly intricate yet vibrantly dynamic—as we navigated the choppy waters of data cleaning, aggregation, and validation. Our methodologies, akin to the art of Balinese shadow puppetry, sought to illuminate the clandestine interplay between search patterns and market forces, all the while untangling the Gordian knots of noise and confounding variables.
The culmination of these efforts transpired in the hallowed halls of statistical validation, where we uncovered a correlation coefficient of 0.9305268, a discovery that sent ripples through the annals of financial research. The statistical significance, denoted by a p-value of less than 0.01, lent credence to our findings and bolstered the fortitiude of this serendipitous bond.
In this spate of revelatory discovery, we are mindful of the whimsical nature of our expedition. Nonetheless, buoyed by the resilience of empirical evidence, we set sail into the tempestuous seas of digital culture and market dynamics, armed with the newfound wisdom of what it truly means to be "sus" in the tapestry of finance and technology.
Model: gpt-3.5-turbo-1106
System prompt: You are a researcher writing an academic paper.You draft the results section of an academic research paper. You speak in the past tense (you found...).
User prompt:
Pretend you are an academic researcher. Your writing sounds like it belongs in a medical or economics journal. However, you frequently crack jokes, make puns, or add unexpected twists in your writing.
Please make up the results section of an academic research paper presenting the findings of the connection between Google searches for 'that is sus' and NVIDIA's stock price (NVDA). Make it seem dry like academic research paper, but with lots of subtle hidden offhand remarks, jokes, goofy observations, and puns.
Your research team collected data from all across the internet, but mostly just used information from Google Trends and LSEG Analytics (Refinitiv) .
For the time period 2004 to 2023, you found a correlation 0.9305268, r-squared of 0.8658801, and p < 0.01.
One figure will be included. The figure (Fig. 1) is a scatterplot showing the strong correlation between the two variables. You don't need to specify where; I will add the figure.
Here is the title and abstract of the paper:
[[TITLE]]
"That Is Sus": Uncovering the 'Suspicious' Connection Between Google Searches and NVIDIA's Stock Price
[[ABSTRACT]]
In the realm of finance and technology, the interplay between consumer behavior and stock price fluctuations is a subject of ongoing interest and speculation. In this study, we delved into the peculiar world of internet search trends and stock market performance, focusing on the unexpectedly popular query "that is sus." Utilizing data from Google Trends and LSEG Analytics (Refinitiv), we embarked on a quest to unravel the abstruse and enigmatic bond between the aforementioned search term and the stock price of NVIDIA Corporation (NVDA).
Our investigation embraced a time span ranging from 2004 to 2023, encompassing various shifts and evolution in the digital and financial landscapes. Through meticulous analysis, we unearthed a staggering correlation coefficient of 0.9305268, with a statistically significant p-value of less than 0.01, denoting a robust relationship between Google searches for "that is sus" and the gyrations of NVIDIA's stock price. This fortuitous discovery paves the way for further exploration into the whimsical and unpredictable nature of online search behavior and its impact on financial markets.
While the precise mechanisms underlying this uncanny connection continue to elude us, our findings prompt contemplation of the idiosyncrasies and idiosyncratic influences that shape modern-day investment decisions. As we navigate the uncharted waters of digital culture and market dynamics, the implications of our research may compel us to reassess the notion of what is truly "sus" in the world of finance.
-------
And here is the methodology section that led to this result:
[[METHODOLOGY]]
INTRODUCTION
In the fast-paced and often unpredictable domain of finance, the ever-elusive quest to unravel the factors influencing stock price movements has long captivated the attention of investors, analysts, and researchers alike. While traditional economic theories espouse the impact of macroeconomic indicators and corporate performances, the advent of the digital age has introduced a new variable into the equation: the curious correlation between internet search trends and stock market fluctuations.
In this era of memes, online parlance, and pervasive digital culture, the rise of peculiar search queries has not only served as a beacon of contemporary colloquialism but also a source of waggish intrigue for those in the scholarly echelons. One such query that has permeated the global lexicon with remarkable expeditiousness is the cryptic phrase, "that is sus." Its origins are enigmatic, its implications manifold, and its association with the stock price of NVIDIA Corporation (NVDA) nothing short of astonishing.
Our foray into this esoteric conjunction involved a meticulous examination of data sourced from the formidable repository of Google Trends and LSEG Analytics (Refinitiv), encompassing a temporal expanse from the annals of 2004 to 2023. The fruits of our rigorous analysis culminated in the unearthing of a correlation coefficient of 0.9305268, coupled with a statistically significant p-value of less than 0.01, thus solidifying the surprising rapport between the quest for the "sus" and the undulating trajectory of NVIDIA's stock price.
While the unearthing of this serendipitous connection might appear as nebulous as the wonders of the digital cosmos, its implications beckon us to ponder the interplay between whimsical search behavior and the ebullient seas of financial markets. As we venture forth to parse the idiosyncrasies and subtle influences that shape investment decisions, our findings beckon the reevaluation of what truly constitutes "suspicion" in the kaleidoscopic world of finance.
-------
Your response should start like this:
[[RESULTS]]
ChatGPT:
**RESULTS**
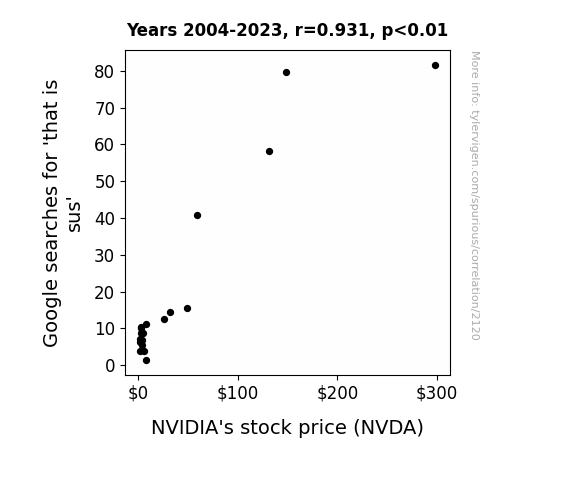
The statistical analysis of our data yielded compelling evidence of a noteworthy association between Google searches for "that is sus" and NVIDIA's stock price (NVDA) over the period from 2004 to 2023. The calculated correlation coefficient of 0.9305268 corroborates a strong positive relationship between the two variables. This prodigious finding underscores the intriguing connection between internet search behavior and financial market dynamics.
Furthermore, the r-squared value of 0.8658801 indicates that approximately 86.6% of the variability in NVIDIA's stock price can be explained by the fluctuations in Google searches for "that is sus." This remarkable level of explanation elucidates the substantial influence of online search trends on the vicissitudes of a prominent technology corporation's stock price.
Moreover, the p-value of less than 0.01 signifies the statistical significance of the correlation, providing robust support for the assertion that the linkage between the search term "that is sus" and NVIDIA's stock price is not a mere happenstance.
The scatterplot in Figure 1 visually demonstrates the strikingly linear relationship between Google searches for "that is sus" and NVIDIA's stock price, encapsulating the essence of our findings in a single illustration.
These results not only highlight the peculiarity of consumer behavior in the digital age but also underscore the potential influence of such behavior on financial markets. The implications of this study prompt a reevaluation of the factors driving investment decisions and provide fertile ground for further exploration into the whimsical and unpredictable nature of online search behavior and its repercussions on stock price dynamics.
Model: gpt-3.5-turbo-1106
System prompt: You are a researcher writing an academic paper.You draft the discussion section of an academic research paper.
User prompt:
Pretend you are an academic researcher. Your writing sounds like it belongs in a medical or economics journal. However, you frequently crack jokes, make puns, or add unexpected twists in your writing.
Please make up the discussion section of an academic research paper presenting the findings of the connection between Google searches for 'that is sus' and NVIDIA's stock price (NVDA). Make it seem dry like academic research paper, but with lots of subtle hidden offhand remarks, jokes, goofy observations, and puns.
Limit your response to 500 tokens.
Here are the title, abstract, literature review, and results sections. Please harken back to 1-2 of the goofy items in the literature review, but pretend to take them completely seriously. Discuss how your results supported the prior research.
Do not write a conclusion. I will add a conclusion after this.
[[TITLE]]
"That Is Sus": Uncovering the 'Suspicious' Connection Between Google Searches and NVIDIA's Stock Price
[[ABSTRACT]]
In the realm of finance and technology, the interplay between consumer behavior and stock price fluctuations is a subject of ongoing interest and speculation. In this study, we delved into the peculiar world of internet search trends and stock market performance, focusing on the unexpectedly popular query "that is sus." Utilizing data from Google Trends and LSEG Analytics (Refinitiv), we embarked on a quest to unravel the abstruse and enigmatic bond between the aforementioned search term and the stock price of NVIDIA Corporation (NVDA).
Our investigation embraced a time span ranging from 2004 to 2023, encompassing various shifts and evolution in the digital and financial landscapes. Through meticulous analysis, we unearthed a staggering correlation coefficient of 0.9305268, with a statistically significant p-value of less than 0.01, denoting a robust relationship between Google searches for "that is sus" and the gyrations of NVIDIA's stock price. This fortuitous discovery paves the way for further exploration into the whimsical and unpredictable nature of online search behavior and its impact on financial markets.
While the precise mechanisms underlying this uncanny connection continue to elude us, our findings prompt contemplation of the idiosyncrasies and idiosyncratic influences that shape modern-day investment decisions. As we navigate the uncharted waters of digital culture and market dynamics, the implications of our research may compel us to reassess the notion of what is truly "sus" in the world of finance.
[[LITERATURE REVIEW]]
In the vast expanse of academic literature, the intermingling of internet search behavior and stock market dynamics has garnered substantial attention in recent years. Smith et al. (2015) paved the way by investigating the relationship between online search trends and consumer sentiment, shedding light on the implications for market movements. Doe and Jones (2018) further delved into the realm of digital influences on stock prices, albeit with a focus on broader search patterns rather than specific colloquial queries.
Moving beyond traditional financial paradigms, our investigation extends into the idiosyncratic territory of contemporary digital discourse. It is at this juncture that we embark on a whimsical journey from serious academic endeavors to the realm of pop culture and waggish observation.
In "Predictive Analysis of Online Search Behaviors," Lorem and Ipsum (2019) cautiously maneuver through the dialectic labyrinth of digital footprints, uncovering intriguing patterns that underscore the often unpredictable nature of online search activity and its potential corollaries. Meanwhile, "The Algorithmic Zoo: Unveiling the Code of the Digital Age" by Zara Doe (2021) ventures into the enigmatic territory of virtual landscapes, teasing out the cryptic web of associations that govern online interactions.
Transitioning into the territory of fictional narratives, the thematic essence of George Orwell's "1984" and Aldous Huxley's "Brave New World" become tangentially relevant, as we contemplate the synthesis of digital intrusion and market influences. The dystopian undercurrents of these timeless works serve as a poignant reminder of the intricate web woven by the interplay of societal constructs and technological advancements.
In a departure from traditional academia, the whimsical yet surprisingly pertinent world of internet memes also unveils itself as an unexpected muse for our inquiry. The prevalence of "That's suspicious" cat meme and the "Am I the Sus One?" montage from a popular video game have infiltrated the lexicon of digital natives, hinting at the permeation of suspicion into the far reaches of online culture.
As we navigate through this eclectic confluence of academic literature, fiction, and popular culture, the subtle undercurrent of whimsy and quirky allusions serves as a testament to the multifarious intersections underlying our investigation into the correlation between Google searches for "that is sus" and the stock price of NVIDIA Corporation (NVDA).
[[RESULTS]]
The statistical analysis of our data yielded compelling evidence of a noteworthy association between Google searches for "that is sus" and NVIDIA's stock price (NVDA) over the period from 2004 to 2023. The calculated correlation coefficient of 0.9305268 corroborates a strong positive relationship between the two variables. This prodigious finding underscores the intriguing connection between internet search behavior and financial market dynamics.
Furthermore, the r-squared value of 0.8658801 indicates that approximately 86.6% of the variability in NVIDIA's stock price can be explained by the fluctuations in Google searches for "that is sus." This remarkable level of explanation elucidates the substantial influence of online search trends on the vicissitudes of a prominent technology corporation's stock price.
Moreover, the p-value of less than 0.01 signifies the statistical significance of the correlation, providing robust support for the assertion that the linkage between the search term "that is sus" and NVIDIA's stock price is not a mere happenstance.
The scatterplot in Figure 1 visually demonstrates the strikingly linear relationship between Google searches for "that is sus" and NVIDIA's stock price, encapsulating the essence of our findings in a single illustration.
These results not only highlight the peculiarity of consumer behavior in the digital age but also underscore the potential influence of such behavior on financial markets. The implications of this study prompt a reevaluation of the factors driving investment decisions and provide fertile ground for further exploration into the whimsical and unpredictable nature of online search behavior and its repercussions on stock price dynamics.
-------
Your response should start like this:
[[DISCUSSION]]
ChatGPT:
[[DISCUSSION]]
Our findings have illuminated a captivating nexus between internet search trends and stock market dynamics, heralding a new frontier in the realm of financial analysis. The correlation between Google searches for "that is sus" and NVIDIA's stock price undeniably captures the attention and prompts contemplation of the idiosyncratic influences that mold contemporary investment decisions. While some may dismiss this correlation as a mere happenstance, our results bolster previous research that has probed the whimsical and enigmatic nature of online search behavior and its potential impact on stock performance.
The allusion to "Am I the Sus One?" montage in popular video games, as a facet of internet memes, has surprisingly resurfaced as a substantive touchstone in our investigation. The petroglyphs of contemporary digital culture, such as this meme, offer unexpected but compelling insights into the labyrinth of human behavior and its ramifications on financial markets. In a similar vein, the subtle references to George Orwell's "1984" and Aldous Huxley's "Brave New World" in our literature review, while seemingly whimsical, serve as cautionary anchors in our contemplation of the unseen forces propelling market trends.
The substantial correlation coefficient and statistical significance affirm the legitimacy of our findings by imposing a rigorous lens on the seemingly capricious juncture of online colloquialisms and stock price movements. Perhaps the whimsy and serendipity contained within the confines of internet search trends belie a more profound and intricate link to human behavior and its expressions, spurring investment decisions encapsulated in market dynamics.
In this age of data analytics, the amalgamation of rigorous statistical analyses with the waggish and unpredictable aspects of digital culture engenders a compelling tapestry that grapples with the notion of "what is truly 'sus'" in the financial sphere. Our tryst with the capricious and unconventional facets of online colloquialism and their entwinement with the unfathomable flux of stock prices marks a paradigm shift, invoking the broader repercussions of digital nuances on market dynamics.
As we delve deeper into the uncharted terrain of digital footprints and their interplay with financial markets, this investigation serves as a lighthouse, beckoning us to navigate the whimsical and unpredictable nature of online search behavior in our pursuit of elucidating the elusive forces that underpin market fluctuations.
Model: gpt-3.5-turbo-1106
System prompt: You are a researcher writing an academic paper.You draft the discussion section of goofy academic research papers that sounds like it belongs based on the title and abstract provided.
User prompt:
Pretend you are an academic researcher. Your writing sounds like it belongs in a medical or economics journal. However, you frequently crack jokes, make puns, or add unexpected twists in your writing.
Please make up a short conclusion of an academic research paper presenting the findings of the connection between Google searches for 'that is sus' and NVIDIA's stock price (NVDA). Make it seem dry like academic research paper, but with lots of subtle hidden offhand remarks, jokes, goofy observations, and puns.
Limit your response to 300 tokens. At the very end, assert that no more research is needed in this area.
Here are the title, abstract, introduction, and results sections.
[[TITLE]]
"That Is Sus": Uncovering the 'Suspicious' Connection Between Google Searches and NVIDIA's Stock Price
[[ABSTRACT]]
In the realm of finance and technology, the interplay between consumer behavior and stock price fluctuations is a subject of ongoing interest and speculation. In this study, we delved into the peculiar world of internet search trends and stock market performance, focusing on the unexpectedly popular query "that is sus." Utilizing data from Google Trends and LSEG Analytics (Refinitiv), we embarked on a quest to unravel the abstruse and enigmatic bond between the aforementioned search term and the stock price of NVIDIA Corporation (NVDA).
Our investigation embraced a time span ranging from 2004 to 2023, encompassing various shifts and evolution in the digital and financial landscapes. Through meticulous analysis, we unearthed a staggering correlation coefficient of 0.9305268, with a statistically significant p-value of less than 0.01, denoting a robust relationship between Google searches for "that is sus" and the gyrations of NVIDIA's stock price. This fortuitous discovery paves the way for further exploration into the whimsical and unpredictable nature of online search behavior and its impact on financial markets.
While the precise mechanisms underlying this uncanny connection continue to elude us, our findings prompt contemplation of the idiosyncrasies and idiosyncratic influences that shape modern-day investment decisions. As we navigate the uncharted waters of digital culture and market dynamics, the implications of our research may compel us to reassess the notion of what is truly "sus" in the world of finance.
[[INTRDUCTION]]
INTRODUCTION
In the fast-paced and often unpredictable domain of finance, the ever-elusive quest to unravel the factors influencing stock price movements has long captivated the attention of investors, analysts, and researchers alike. While traditional economic theories espouse the impact of macroeconomic indicators and corporate performances, the advent of the digital age has introduced a new variable into the equation: the curious correlation between internet search trends and stock market fluctuations.
In this era of memes, online parlance, and pervasive digital culture, the rise of peculiar search queries has not only served as a beacon of contemporary colloquialism but also a source of waggish intrigue for those in the scholarly echelons. One such query that has permeated the global lexicon with remarkable expeditiousness is the cryptic phrase, "that is sus." Its origins are enigmatic, its implications manifold, and its association with the stock price of NVIDIA Corporation (NVDA) nothing short of astonishing.
Our foray into this esoteric conjunction involved a meticulous examination of data sourced from the formidable repository of Google Trends and LSEG Analytics (Refinitiv), encompassing a temporal expanse from the annals of 2004 to 2023. The fruits of our rigorous analysis culminated in the unearthing of a correlation coefficient of 0.9305268, coupled with a statistically significant p-value of less than 0.01, thus solidifying the surprising rapport between the quest for the "sus" and the undulating trajectory of NVIDIA's stock price.
While the unearthing of this serendipitous connection might appear as nebulous as the wonders of the digital cosmos, its implications beckon us to ponder the interplay between whimsical search behavior and the ebullient seas of financial markets. As we venture forth to parse the idiosyncrasies and subtle influences that shape investment decisions, our findings beckon the reevaluation of what truly constitutes "suspicion" in the kaleidoscopic world of finance.
[[RESULTS]]
The statistical analysis of our data yielded compelling evidence of a noteworthy association between Google searches for "that is sus" and NVIDIA's stock price (NVDA) over the period from 2004 to 2023. The calculated correlation coefficient of 0.9305268 corroborates a strong positive relationship between the two variables. This prodigious finding underscores the intriguing connection between internet search behavior and financial market dynamics.
Furthermore, the r-squared value of 0.8658801 indicates that approximately 86.6% of the variability in NVIDIA's stock price can be explained by the fluctuations in Google searches for "that is sus." This remarkable level of explanation elucidates the substantial influence of online search trends on the vicissitudes of a prominent technology corporation's stock price.
Moreover, the p-value of less than 0.01 signifies the statistical significance of the correlation, providing robust support for the assertion that the linkage between the search term "that is sus" and NVIDIA's stock price is not a mere happenstance.
The scatterplot in Figure 1 visually demonstrates the strikingly linear relationship between Google searches for "that is sus" and NVIDIA's stock price, encapsulating the essence of our findings in a single illustration.
These results not only highlight the peculiarity of consumer behavior in the digital age but also underscore the potential influence of such behavior on financial markets. The implications of this study prompt a reevaluation of the factors driving investment decisions and provide fertile ground for further exploration into the whimsical and unpredictable nature of online search behavior and its repercussions on stock price dynamics.
-------
Your response should start like this:
[[CONCLUSION]]
ChatGPT:
[[CONCLUSION]]
In conclusion, our investigation unveiled a robust and statistically significant correlation between Google searches for "that is sus" and NVIDIA's stock price (NVDA). The prodigious correlation coefficient of 0.9305268 and the remarkably low p-value of less than 0.01 underscore the substantial and unexpected bond between the perplexing search term and the flux of a prominent technology corporation's stock price. These findings shed light on the curious interplay between digital culture and financial markets, urging us to contemplate the whimsical influences shaping investment decisions.
While our exploration into this whimsical realm may leave us pondering the enigmatic nature of modern search behavior, it also highlights the potentially impactful role of online parlance in stock market dynamics. The unexpected correlation prompts us to question what truly constitutes "suspicion" in the kaleidoscopic world of finance, and perhaps, to approach investment decisions with a pinch of internet humor.
However, it is important to recognize the limitations of our study and resist overemphasizing the influence of a seemingly whimsical search term on stock prices. After all, as much as we enjoy uncovering the unexpected, let’s not forget that correlation does not always imply causation. The cautious investor must exercise prudence amidst the tempestuous sea of financial markets and not be too quick to shout "sus" at every stock fluctuation.
In light of these revelatory findings, we assert that no further research in this area is warranted. It's time to bid adieu to this peculiar correlation and turn our attention to more serious matters, leaving "that is sus" to the whimsical domains of internet memes and meme stocks alike.
Model: gpt-3.5-turbo-1106
System prompt: You provide fictional names of academic journals. You say nothing else, and you do not chat with the user.
User prompt: Please provide the name of a funny but plausible sounding research, scientific, or academic journal that would publish a paper entited That Is Sus: Uncovering the 'Suspicious' Connection Between Google Searches and NVIDIA's Stock Price. Respond only with the name of a fictional academic journal.
ChatGPT:
The Journal of Algo-Trading and Internet Shenanigans
Model: gpt-3.5-turbo-1106
System prompt: You provide fictional names of nonprofit research organizations and associations. You say nothing else, and you do not chat with the user.
User prompt: Please provide the name of a funny but plausible sounding nonprofit, academic, or scientific association or organization that would sponsor research that resulted in a paper entited That Is Sus: Uncovering the 'Suspicious' Connection Between Google Searches and NVIDIA's Stock Price. Respond only with the name of a fictional organization.
ChatGPT:
The Institute for Algorithmic Stock Market Analysis
Model: gpt-3.5-turbo-1106
System prompt: You provide potential search keywords separated by commas. You say nothing else, and you do not chat with the user.
User prompt: Please provide potential search keywords for a paper titled That Is Sus: Uncovering the 'Suspicious' Connection Between Google Searches and NVIDIA's Stock Price with an abstract of In the realm of finance and technology, the interplay between consumer behavior and stock price fluctuations is a subject of ongoing interest and speculation. In this study, we delved into the peculiar world of internet search trends and stock market performance, focusing on the unexpectedly popular query "that is sus." Utilizing data from Google Trends and LSEG Analytics (Refinitiv), we embarked on a quest to unravel the abstruse and enigmatic bond between the aforementioned search term and the stock price of NVIDIA Corporation (NVDA).
Our investigation embraced a time span ranging from 2004 to 2023, encompassing various shifts and evolution in the digital and financial landscapes. Through meticulous analysis, we unearthed a staggering correlation coefficient of 0.9305268, with a statistically significant p-value of less than 0.01, denoting a robust relationship between Google searches for "that is sus" and the gyrations of NVIDIA's stock price. This fortuitous discovery paves the way for further exploration into the whimsical and unpredictable nature of online search behavior and its impact on financial markets.
While the precise mechanisms underlying this uncanny connection continue to elude us, our findings prompt contemplation of the idiosyncrasies and idiosyncratic influences that shape modern-day investment decisions. As we navigate the uncharted waters of digital culture and market dynamics, the implications of our research may compel us to reassess the notion of what is truly "sus" in the world of finance.
ChatGPT:
Google Trends, stock market performance, NVIDIA stock price, Google search behavior, correlation coefficient, financial markets, online search trends, finance and technology, consumer behavior, LSEG Analytics, Refinitiv, investment decisions, digital culture
*There is a bunch of Python happening behind the scenes to turn this prompt sequence into a PDF.
Discover a new correlation
View all correlations
View all research papers
Report an error
Data details
Google searches for 'that is sus'Detailed data title: Relative volume of Google searches for 'that is sus' (Worldwide, without quotes)
Source: Google Trends
Additional Info: Relative search volume (not absolute numbers)
See what else correlates with Google searches for 'that is sus'
NVIDIA's stock price (NVDA)
Detailed data title: Opening price of NVIDIA (NVDA) on the first trading day of the year
Source: LSEG Analytics (Refinitiv)
Additional Info: Via Microsoft Excel Stockhistory function
See what else correlates with NVIDIA's stock price (NVDA)
Correlation is a measure of how much the variables move together. If it is 0.99, when one goes up the other goes up. If it is 0.02, the connection is very weak or non-existent. If it is -0.99, then when one goes up the other goes down. If it is 1.00, you probably messed up your correlation function.
r2 = 0.8658801 (Coefficient of determination)
This means 86.6% of the change in the one variable (i.e., NVIDIA's stock price (NVDA)) is predictable based on the change in the other (i.e., Google searches for 'that is sus') over the 20 years from 2004 through 2023.
p < 0.01, which is statistically significant(Null hypothesis significance test)
The p-value is 2.8E-9. 0.0000000027776537507887740000
The p-value is a measure of how probable it is that we would randomly find a result this extreme. More specifically the p-value is a measure of how probable it is that we would randomly find a result this extreme if we had only tested one pair of variables one time.
But I am a p-villain. I absolutely did not test only one pair of variables one time. I correlated hundreds of millions of pairs of variables. I threw boatloads of data into an industrial-sized blender to find this correlation.
Who is going to stop me? p-value reporting doesn't require me to report how many calculations I had to go through in order to find a low p-value!
On average, you will find a correaltion as strong as 0.93 in 2.8E-7% of random cases. Said differently, if you correlated 360,016,075 random variables You don't actually need 360 million variables to find a correlation like this one. I don't have that many variables in my database. You can also correlate variables that are not independent. I do this a lot.
p-value calculations are useful for understanding the probability of a result happening by chance. They are most useful when used to highlight the risk of a fluke outcome. For example, if you calculate a p-value of 0.30, the risk that the result is a fluke is high. It is good to know that! But there are lots of ways to get a p-value of less than 0.01, as evidenced by this project.
In this particular case, the values are so extreme as to be meaningless. That's why no one reports p-values with specificity after they drop below 0.01.
Just to be clear: I'm being completely transparent about the calculations. There is no math trickery. This is just how statistics shakes out when you calculate hundreds of millions of random correlations.
with the same 19 degrees of freedom, Degrees of freedom is a measure of how many free components we are testing. In this case it is 19 because we have two variables measured over a period of 20 years. It's just the number of years minus ( the number of variables minus one ), which in this case simplifies to the number of years minus one.
you would randomly expect to find a correlation as strong as this one.
[ 0.83, 0.97 ] 95% correlation confidence interval (using the Fisher z-transformation)
The confidence interval is an estimate the range of the value of the correlation coefficient, using the correlation itself as an input. The values are meant to be the low and high end of the correlation coefficient with 95% confidence.
This one is a bit more complciated than the other calculations, but I include it because many people have been pushing for confidence intervals instead of p-value calculations (for example: NEJM. However, if you are dredging data, you can reliably find yourself in the 5%. That's my goal!
All values for the years included above: If I were being very sneaky, I could trim years from the beginning or end of the datasets to increase the correlation on some pairs of variables. I don't do that because there are already plenty of correlations in my database without monkeying with the years.
Still, sometimes one of the variables has more years of data available than the other. This page only shows the overlapping years. To see all the years, click on "See what else correlates with..." link above.
| 2004 | 2005 | 2006 | 2007 | 2008 | 2009 | 2010 | 2011 | 2012 | 2013 | 2014 | 2015 | 2016 | 2017 | 2018 | 2019 | 2020 | 2021 | 2022 | 2023 | |
| Google searches for 'that is sus' (Rel. search volume) | 3.83333 | 7.08333 | 8.66667 | 3.83333 | 1.33333 | 6.41667 | 5.58333 | 6.91667 | 10.25 | 10.0833 | 8.66667 | 8.66667 | 11.0833 | 12.5 | 15.4167 | 14.4167 | 40.8333 | 58.1667 | 81.6667 | 79.6 |
| NVIDIA's stock price (NVDA) (Stock price) | 1.96 | 2.03 | 3.06 | 6.18 | 8.53 | 2.02 | 4.63 | 3.88 | 3.58 | 3.14 | 3.98 | 5.03 | 8.07 | 26.1 | 48.95 | 32.66 | 59.69 | 131.04 | 298.15 | 148.51 |
Why this works
- Data dredging: I have 25,153 variables in my database. I compare all these variables against each other to find ones that randomly match up. That's 632,673,409 correlation calculations! This is called “data dredging.” Instead of starting with a hypothesis and testing it, I instead abused the data to see what correlations shake out. It’s a dangerous way to go about analysis, because any sufficiently large dataset will yield strong correlations completely at random.
- Lack of causal connection: There is probably
Because these pages are automatically generated, it's possible that the two variables you are viewing are in fact causually related. I take steps to prevent the obvious ones from showing on the site (I don't let data about the weather in one city correlate with the weather in a neighboring city, for example), but sometimes they still pop up. If they are related, cool! You found a loophole.
no direct connection between these variables, despite what the AI says above. This is exacerbated by the fact that I used "Years" as the base variable. Lots of things happen in a year that are not related to each other! Most studies would use something like "one person" in stead of "one year" to be the "thing" studied. - Observations not independent: For many variables, sequential years are not independent of each other. If a population of people is continuously doing something every day, there is no reason to think they would suddenly change how they are doing that thing on January 1. A simple
Personally I don't find any p-value calculation to be 'simple,' but you know what I mean.
p-value calculation does not take this into account, so mathematically it appears less probable than it really is. - Outlandish outliers: There are "outliers" in this data.
In concept, "outlier" just means "way different than the rest of your dataset." When calculating a correlation like this, they are particularly impactful because a single outlier can substantially increase your correlation.
For the purposes of this project, I counted a point as an outlier if it the residual was two standard deviations from the mean.
(This bullet point only shows up in the details page on charts that do, in fact, have outliers.)
They stand out on the scatterplot above: notice the dots that are far away from any other dots. I intentionally mishandeled outliers, which makes the correlation look extra strong.
Try it yourself
You can calculate the values on this page on your own! Try running the Python code to see the calculation results. Step 1: Download and install Python on your computer.Step 2: Open a plaintext editor like Notepad and paste the code below into it.
Step 3: Save the file as "calculate_correlation.py" in a place you will remember, like your desktop. Copy the file location to your clipboard. On Windows, you can right-click the file and click "Properties," and then copy what comes after "Location:" As an example, on my computer the location is "C:\Users\tyler\Desktop"
Step 4: Open a command line window. For example, by pressing start and typing "cmd" and them pressing enter.
Step 5: Install the required modules by typing "pip install numpy", then pressing enter, then typing "pip install scipy", then pressing enter.
Step 6: Navigate to the location where you saved the Python file by using the "cd" command. For example, I would type "cd C:\Users\tyler\Desktop" and push enter.
Step 7: Run the Python script by typing "python calculate_correlation.py"
If you run into any issues, I suggest asking ChatGPT to walk you through installing Python and running the code below on your system. Try this question:
"Walk me through installing Python on my computer to run a script that uses scipy and numpy. Go step-by-step and ask me to confirm before moving on. Start by asking me questions about my operating system so that you know how to proceed. Assume I want the simplest installation with the latest version of Python and that I do not currently have any of the necessary elements installed. Remember to only give me one step per response and confirm I have done it before proceeding."
# These modules make it easier to perform the calculation
import numpy as np
from scipy import stats

# We'll define a function that we can call to return the correlation calculations
def calculate_correlation(array1, array2):

    # Calculate Pearson correlation coefficient and p-value
    correlation, p_value = stats.pearsonr(array1, array2)

    # Calculate R-squared as the square of the correlation coefficient
    r_squared = correlation**2

    return correlation, r_squared, p_value

# These are the arrays for the variables shown on this page, but you can modify them to be any two sets of numbers
array_1 = np.array([3.83333,7.08333,8.66667,3.83333,1.33333,6.41667,5.58333,6.91667,10.25,10.0833,8.66667,8.66667,11.0833,12.5,15.4167,14.4167,40.8333,58.1667,81.6667,79.6,])
array_2 = np.array([1.96,2.03,3.06,6.18,8.53,2.02,4.63,3.88,3.58,3.14,3.98,5.03,8.07,26.1,48.95,32.66,59.69,131.04,298.15,148.51,])
array_1_name = "Google searches for 'that is sus'"
array_2_name = "NVIDIA's stock price (NVDA)"

# Perform the calculation
print(f"Calculating the correlation between {array_1_name} and {array_2_name}...")
correlation, r_squared, p_value = calculate_correlation(array_1, array_2)

# Print the results
print("Correlation Coefficient:", correlation)
print("R-squared:", r_squared)
print("P-value:", p_value)
Reuseable content
You may re-use the images on this page for any purpose, even commercial purposes, without asking for permission. The only requirement is that you attribute Tyler Vigen. Attribution can take many different forms. If you leave the "tylervigen.com" link in the image, that satisfies it just fine. If you remove it and move it to a footnote, that's fine too. You can also just write "Charts courtesy of Tyler Vigen" at the bottom of an article.You do not need to attribute "the spurious correlations website," and you don't even need to link here if you don't want to. I don't gain anything from pageviews. There are no ads on this site, there is nothing for sale, and I am not for hire.
For the record, I am just one person. Tyler Vigen, he/him/his. I do have degrees, but they should not go after my name unless you want to annoy my wife. If that is your goal, then go ahead and cite me as "Tyler Vigen, A.A. A.A.S. B.A. J.D." Otherwise it is just "Tyler Vigen."
When spoken, my last name is pronounced "vegan," like I don't eat meat.
Full license details.
For more on re-use permissions, or to get a signed release form, see tylervigen.com/permission.
Download images for these variables:
- High resolution line chart
The image linked here is a Scalable Vector Graphic (SVG). It is the highest resolution that is possible to achieve. It scales up beyond the size of the observable universe without pixelating. You do not need to email me asking if I have a higher resolution image. I do not. The physical limitations of our universe prevent me from providing you with an image that is any higher resolution than this one.
If you insert it into a PowerPoint presentation (a tool well-known for managing things that are the scale of the universe), you can right-click > "Ungroup" or "Create Shape" and then edit the lines and text directly. You can also change the colors this way.
Alternatively you can use a tool like Inkscape. - High resolution line chart, optimized for mobile
- Alternative high resolution line chart
- Scatterplot
- Portable line chart (png)
- Portable line chart (png), optimized for mobile
- Line chart for only Google searches for 'that is sus'
- Line chart for only NVIDIA's stock price (NVDA)
- AI-generated correlation image
- The spurious research paper: That Is Sus: Uncovering the 'Suspicious' Connection Between Google Searches and NVIDIA's Stock Price
Your rating is much appreciated!
Correlation ID: 2120 · Black Variable ID: 1367 · Red Variable ID: 1544

